Example: MutiSolSegment Cell EL segmentation
In this example we segment solar cell EL images
[1]:
import os
from pathlib import Path

project_root = Path.cwd().parents[1]
os.chdir(project_root)   # now cwd is .../pvcracks

import matplotlib.pyplot as plt
import numpy as np
import pandas as pd
import torch

from pvcracks.utils import train_functions
from pvcracks.utils.segmentation import segment

import requests

from PIL import Image
[2]:
root = Path.cwd()
print(root)
/home/nrjost/githome/pvcracks
Download MutiSolSegment weights (https://doi.org/10.21948/2997859)
[3]:
weight_path = "multisolsegment.pt"
response = requests.get("https://datahub.duramat.org/dataset/24d7ed98-956e-4ebc-bf21-6584ecec2ff1/resource/e6d5dee2-0aef-439e-978c-d8c572e7039e/download/model.pt")

with open(weight_path, "wb") as f:
    f.write(response.content)
Load MultisolSegment
[4]:
category_mapping = {0: "dark", 1: "busbar", 2: "crack", 3: "non-cell"}

device, model = train_functions.load_device_and_model(
    category_mapping, existing_weight_path=weight_path
)
Example EL Images
[5]:
Cell9Master = pd.read_csv('docs/data/ELdata_module_209.csv', index_col=0)
Load one EL Image convert and resize (prepare for segemntation)
[ ]:
from torchvision import transforms
import torchvision.transforms.functional as F
ELPath = Cell9Master.ELPath[25] #Specific image with cracks
image_raw = Image.open(f"{os.getcwd()}{ELPath}") #Load image with PIL
image_rgb = image_raw.convert("RGB") #Convert to GPB
image_rot = image_rgb.rotate(90, expand=True) #Rotate to have busbars horizontal to be detected with segmentation model
image = F.resize(image_rot, (400, 400), interpolation=transforms.InterpolationMode.BILINEAR)
#image has to be sized 400x400 to work with the segmentation model
# arr = np.asarray(image) #convert image into np.array, not necessary if PIL.Image
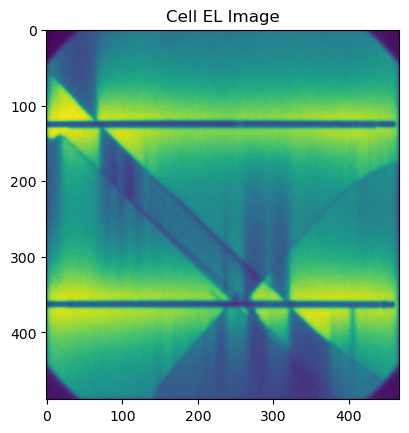
plt.imshow(image_rot)
plt.title("Cell EL Image")
Text(0.5, 1.0, 'Cell EL Image')
Segment the EL image
[7]:
dark, bb, crack, nocell = segment(image, device, model)
Plot all segmented masks side by side
[8]:
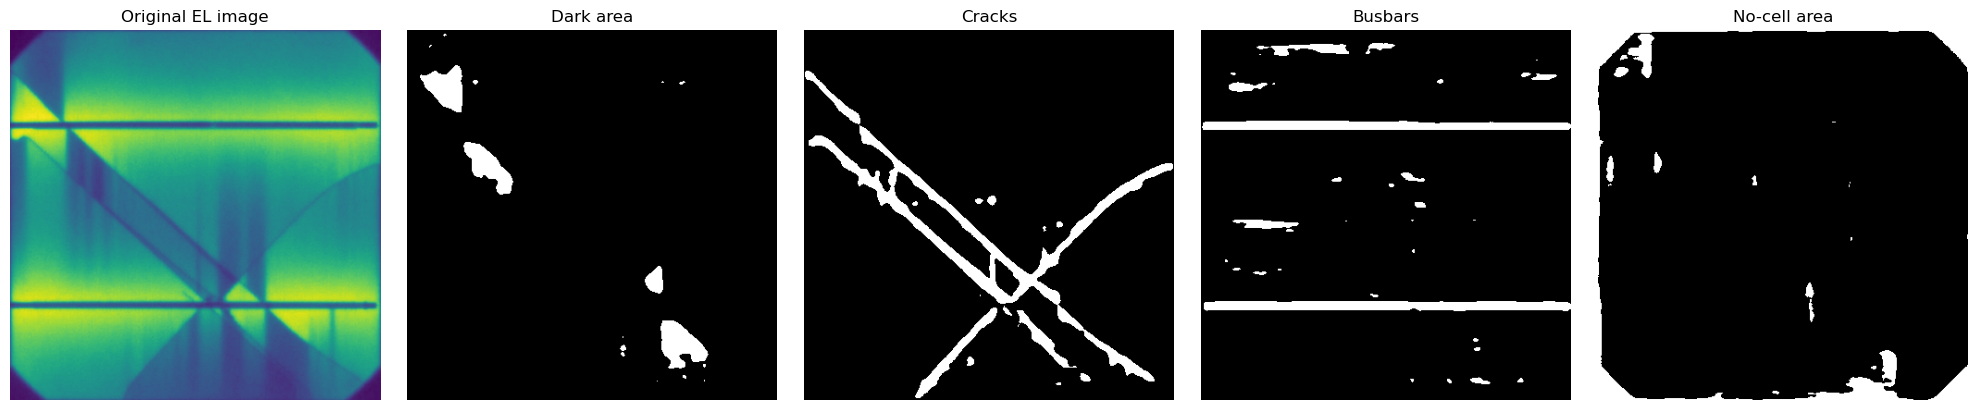
arrays = [image, dark, crack, bb, nocell]
titles = [
    "Original EL image",
    "Dark area",
    "Cracks",
    "Busbars",
    "No-cell area"
]

# create a row of 5 plots
fig, axes = plt.subplots(1, 5, figsize=(20, 4))

for ax, arrimg, title in zip(axes, arrays, titles):
    im = ax.imshow(arrimg, cmap="gray")   # or choose another cmap
    ax.set_title(title, fontsize=12)
    ax.axis("off")

plt.tight_layout()
plt.show()
Segment all images
EL images are loaded
Images are converted to RGB, rotated and resized
Images are passed through the segmentation model
Images and masks are plotted
This is the same approach that would be used for making the training dataset of the VAE model
[9]:
for ind, row in Cell9Master.iterrows():
    image_raw = Image.open(f"{os.getcwd()}{row.ELPath}") #Load image with PIL
    image_rgb = image_raw.convert("RGB") #Convert to GPB
    image_rot = image_rgb.rotate(90, expand=True) #Rotate to have busbars horizontal to be detected with segmentation model
    image = F.resize(image_rot, (400, 400), interpolation=transforms.InterpolationMode.BILINEAR)

    dark, bb, crack, nocell = segment(image, device, model) #segment

    arrays = [image, dark, crack, bb, nocell]
    fig, axes = plt.subplots(1, 5, figsize=(20, 4))
    for ax, arrimg, title in zip(axes, arrays, titles):
        im = ax.imshow(arrimg, cmap="gray")   # or choose another cmap
        ax.set_title(title, fontsize=12)
        ax.axis("off")

    plt.tight_layout()
    plt.show()
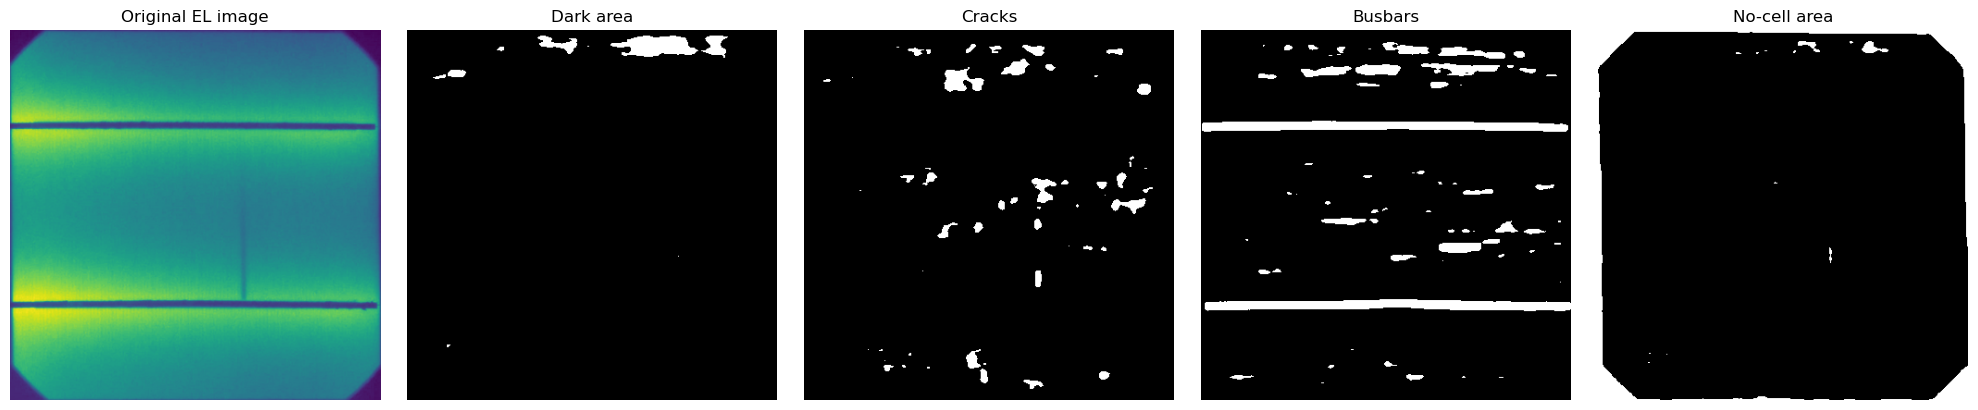
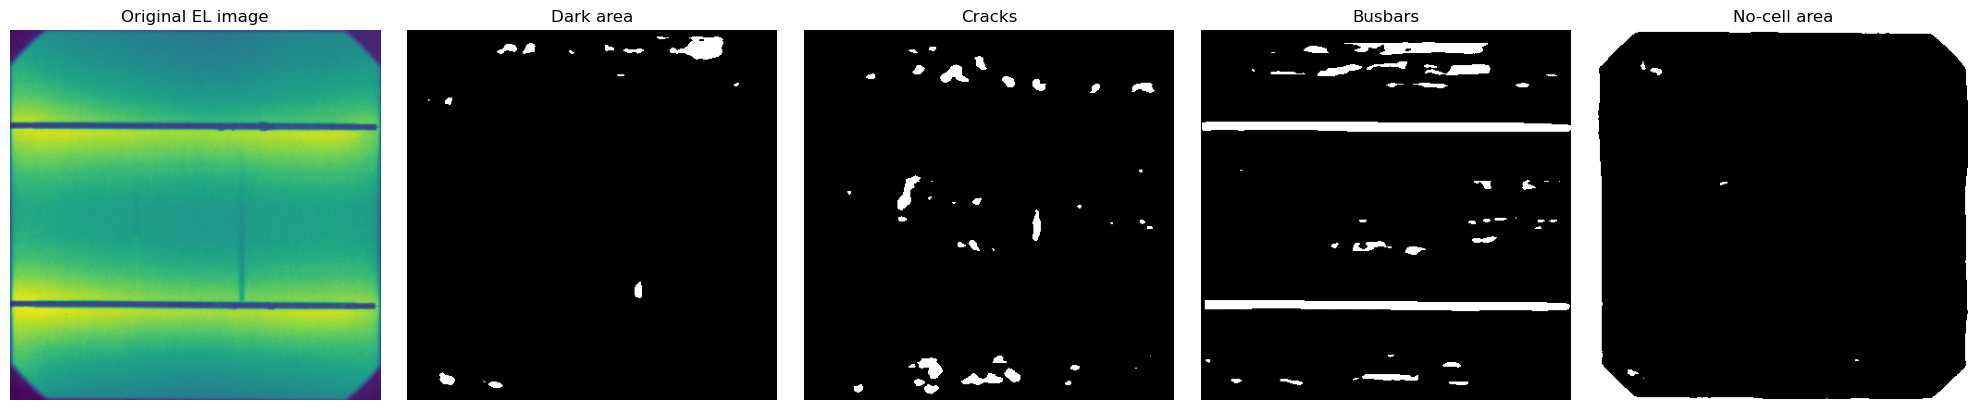
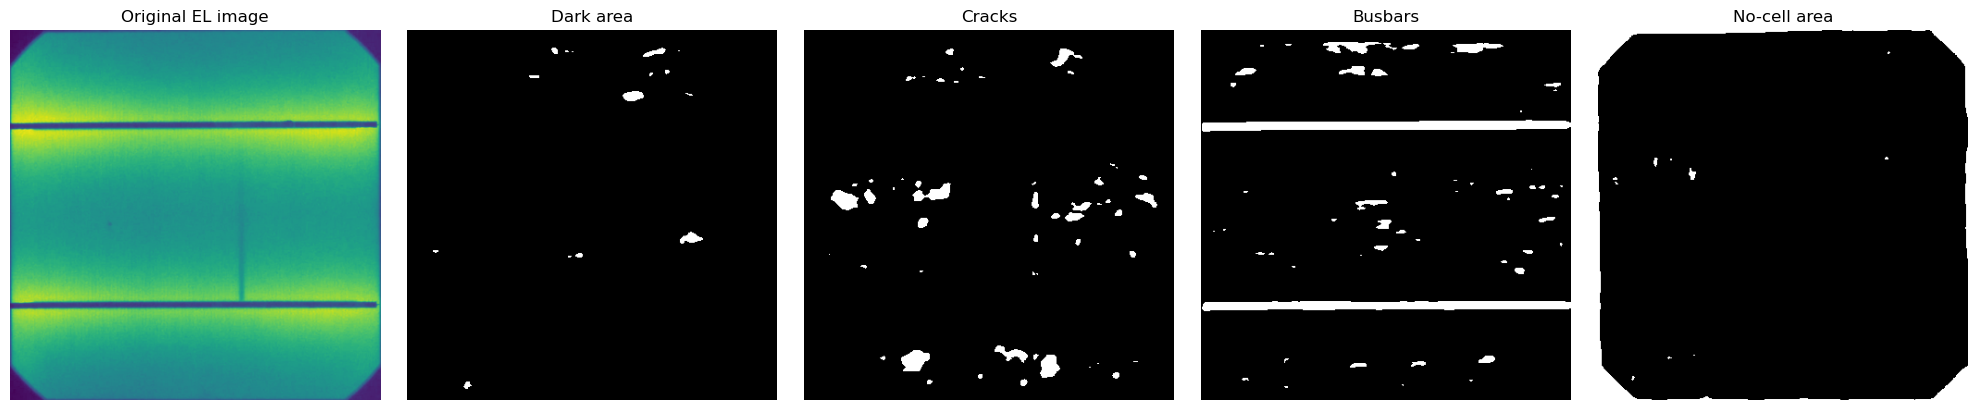
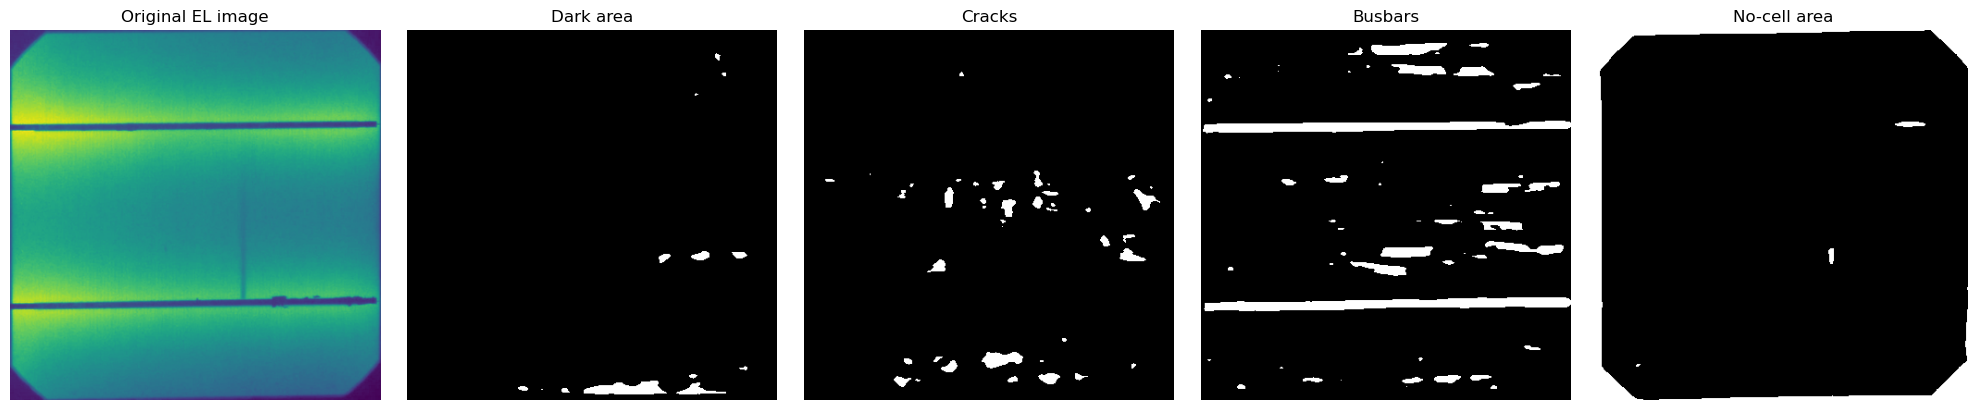
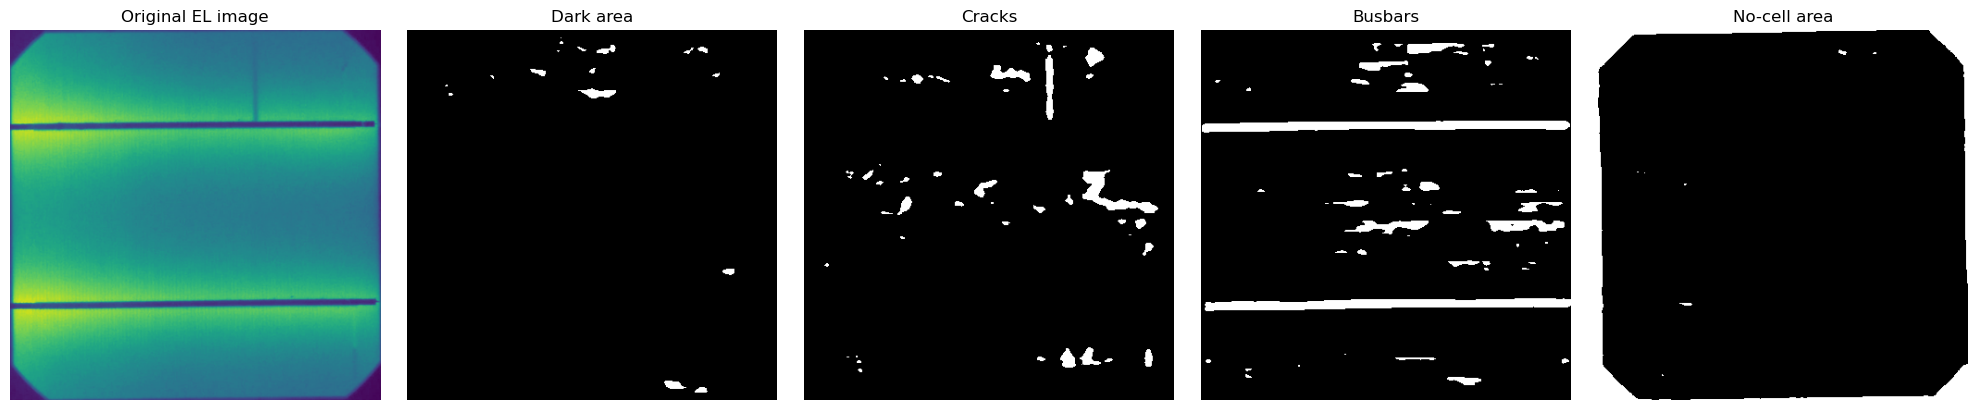
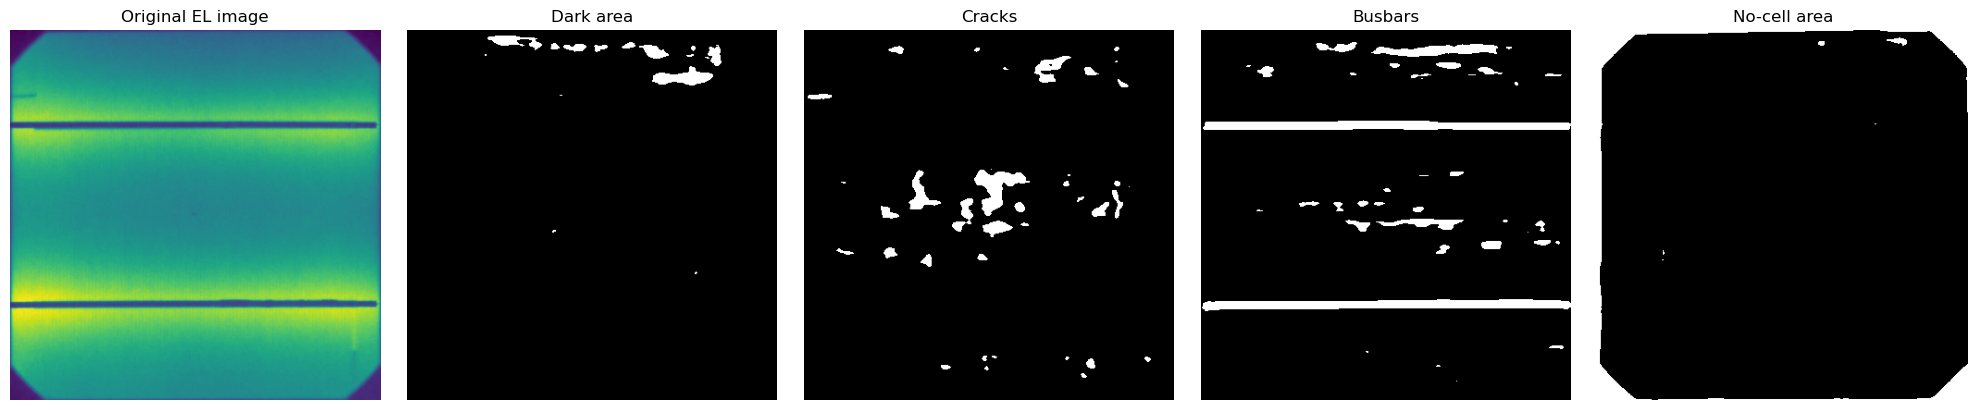
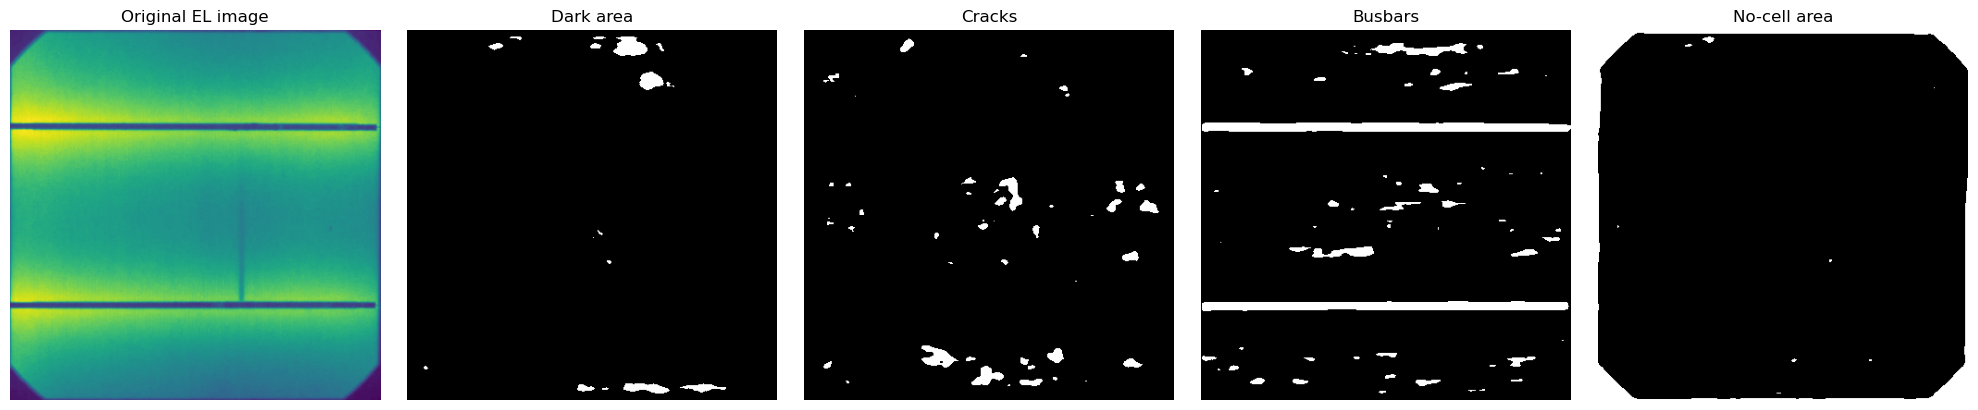
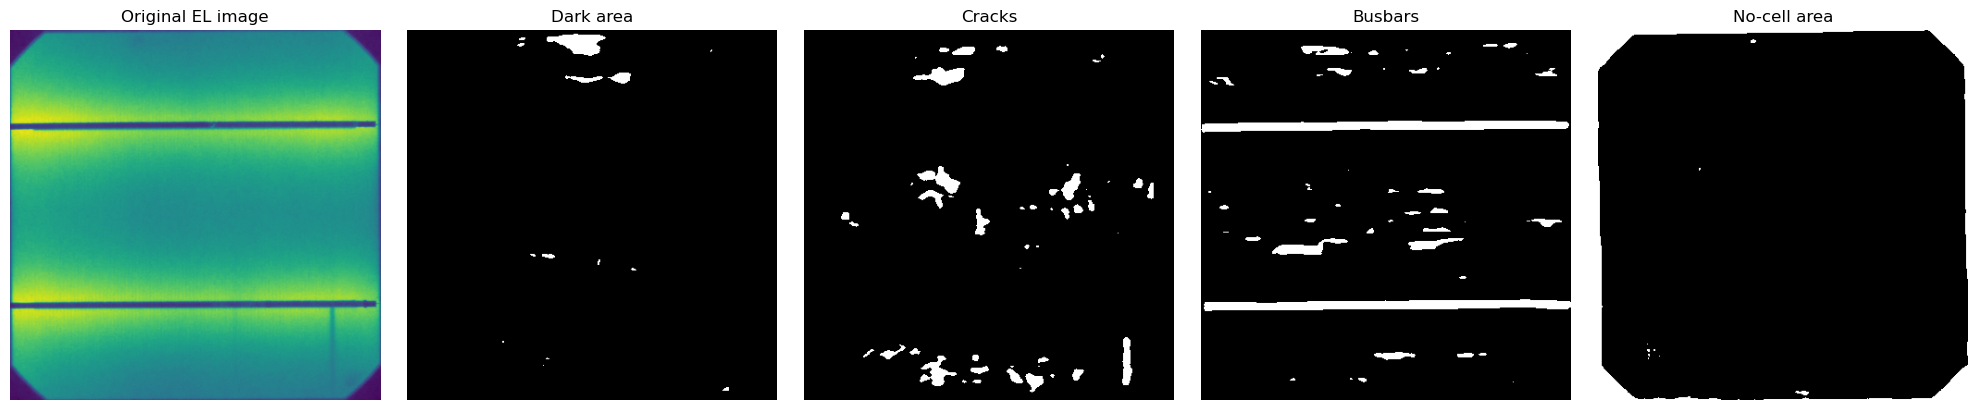
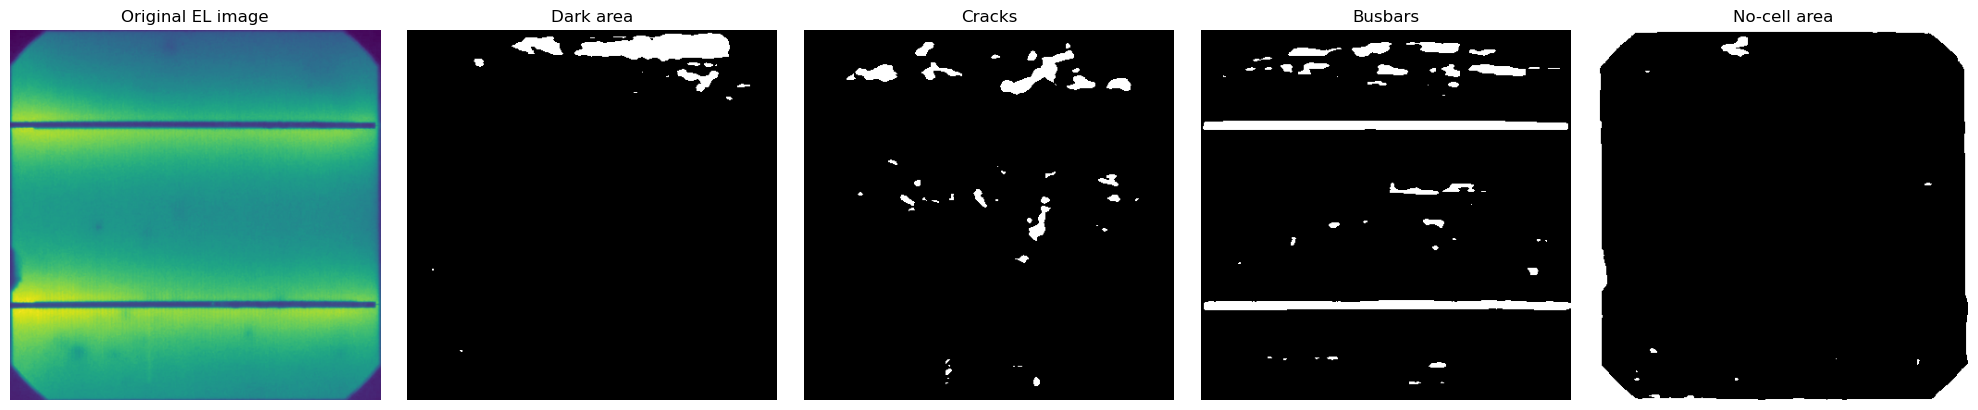
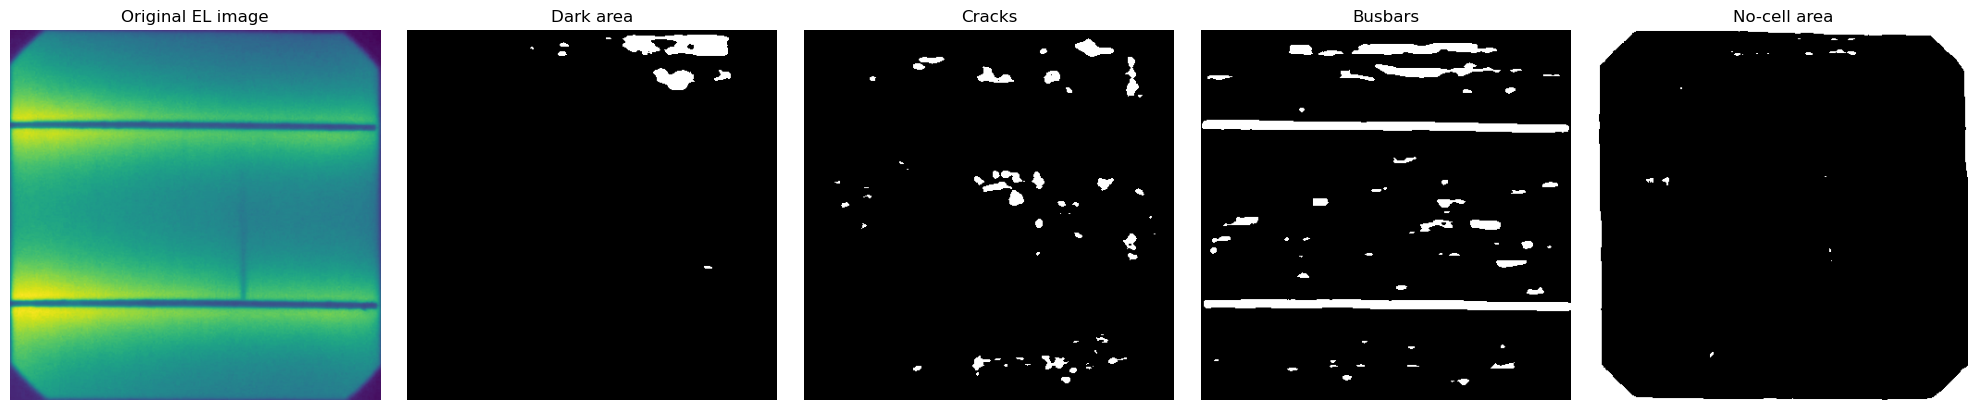
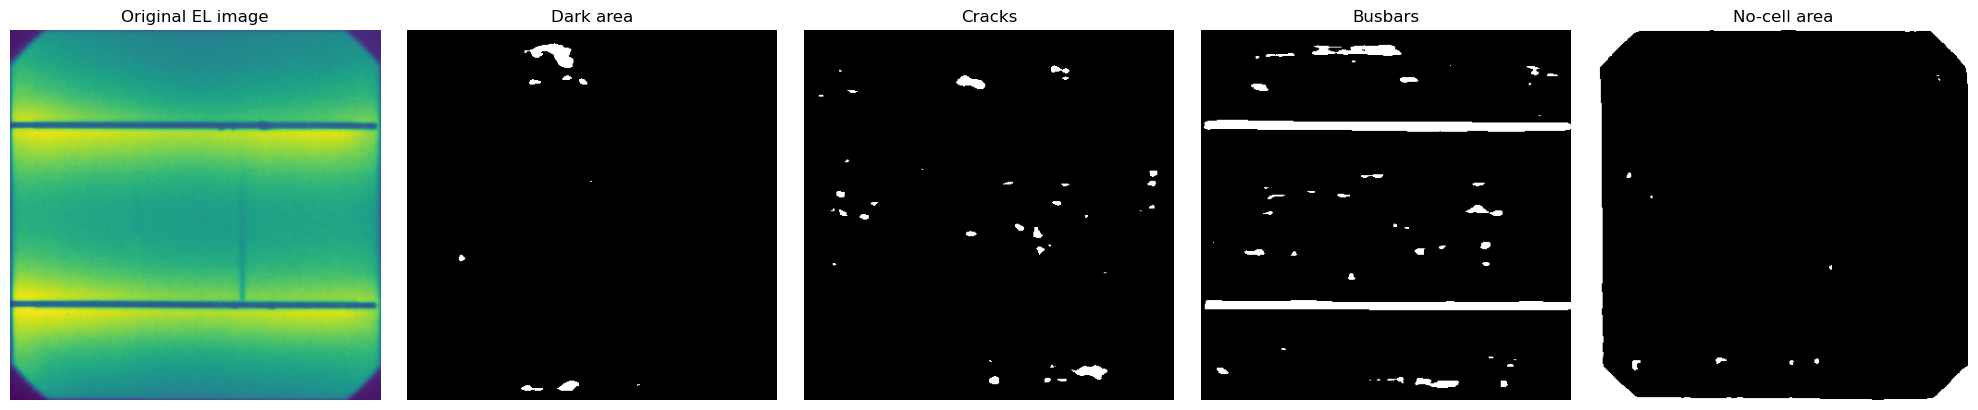
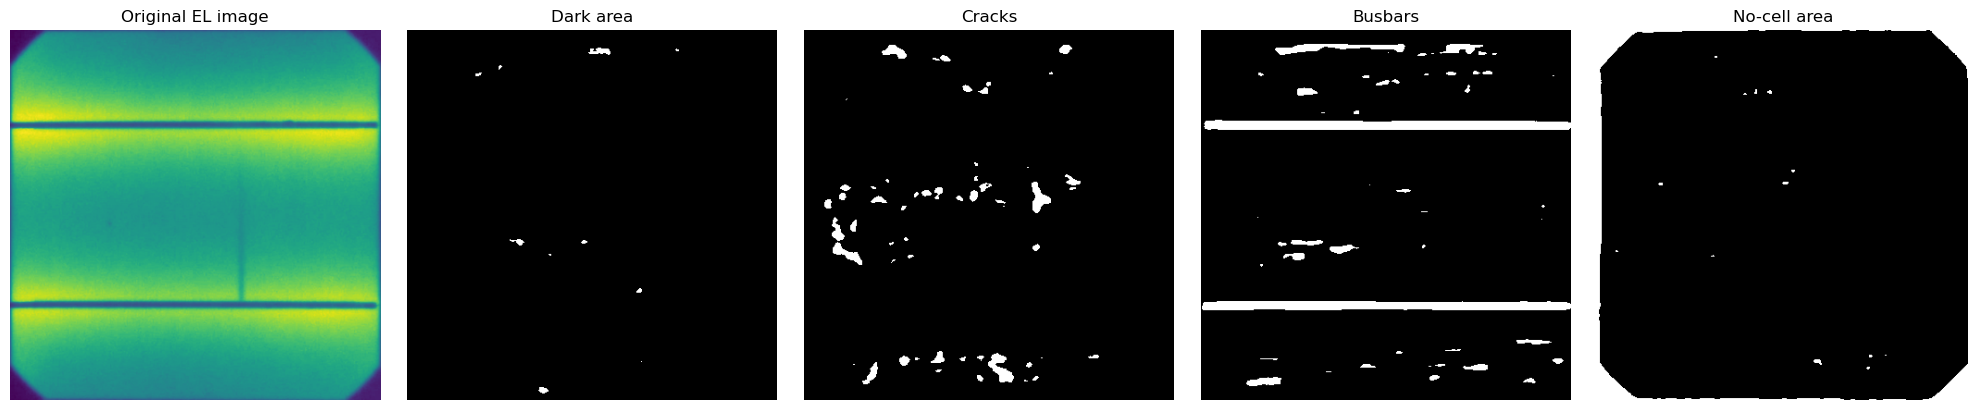
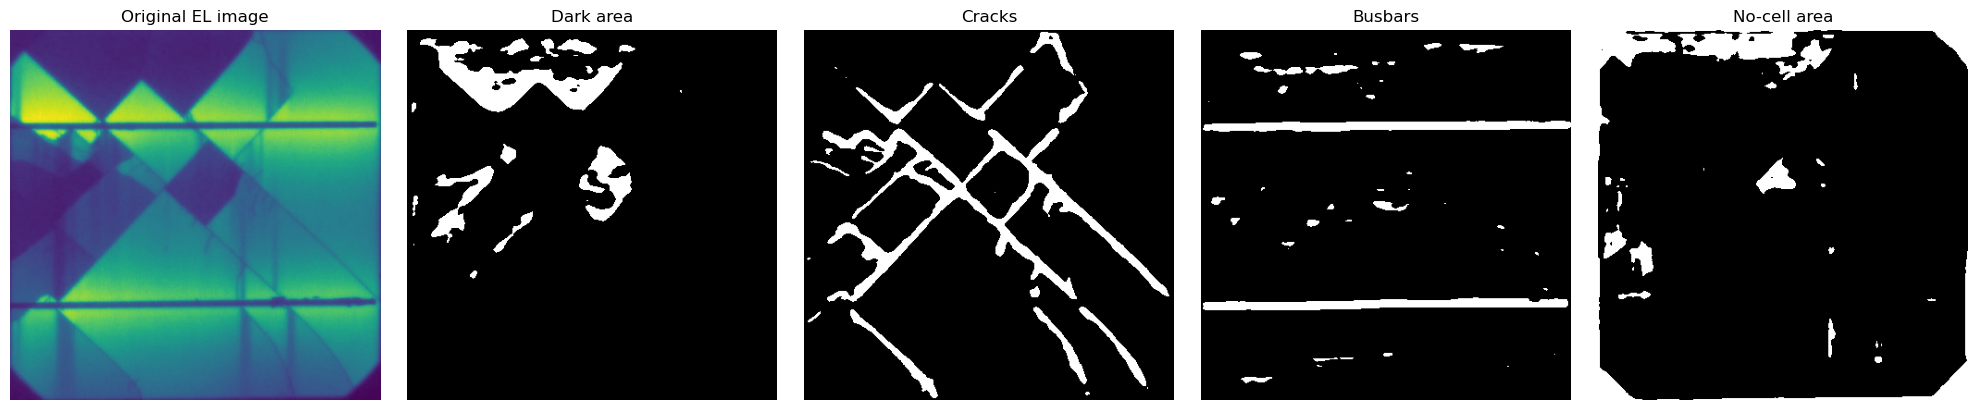
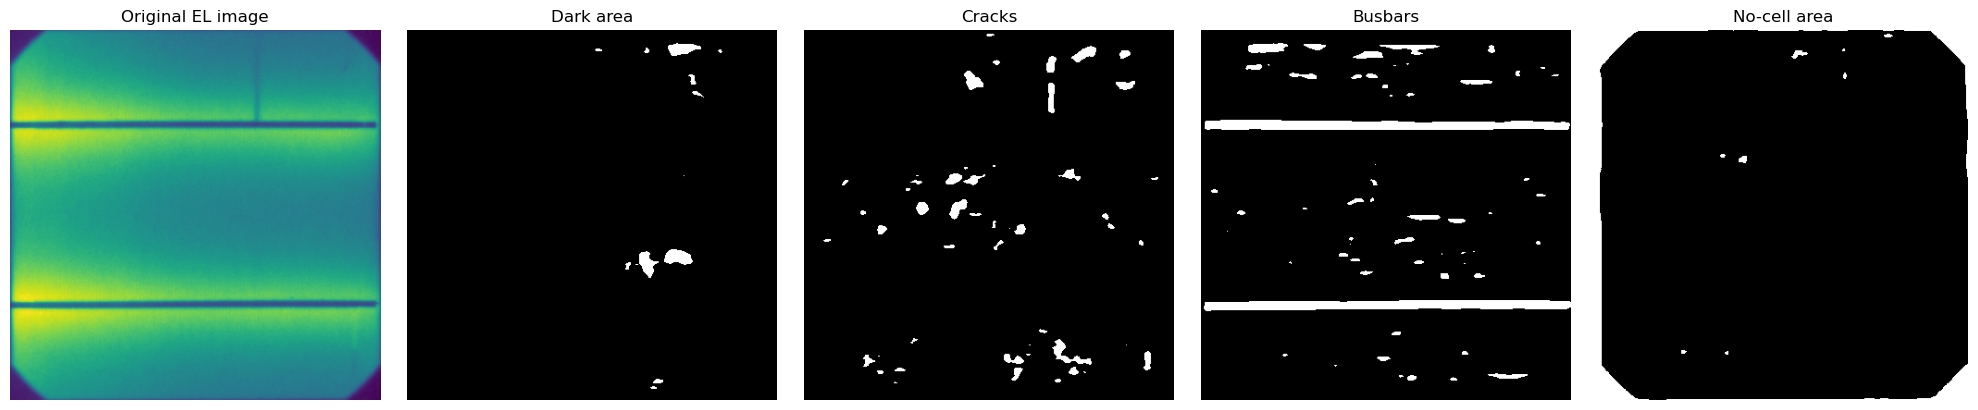
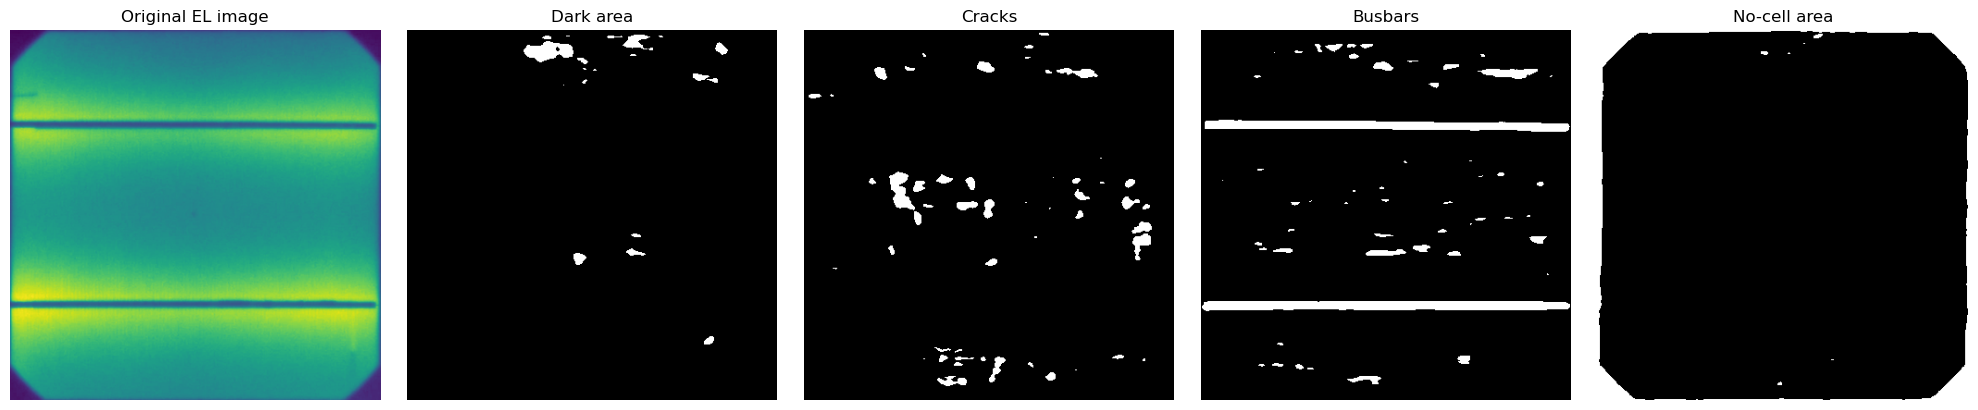
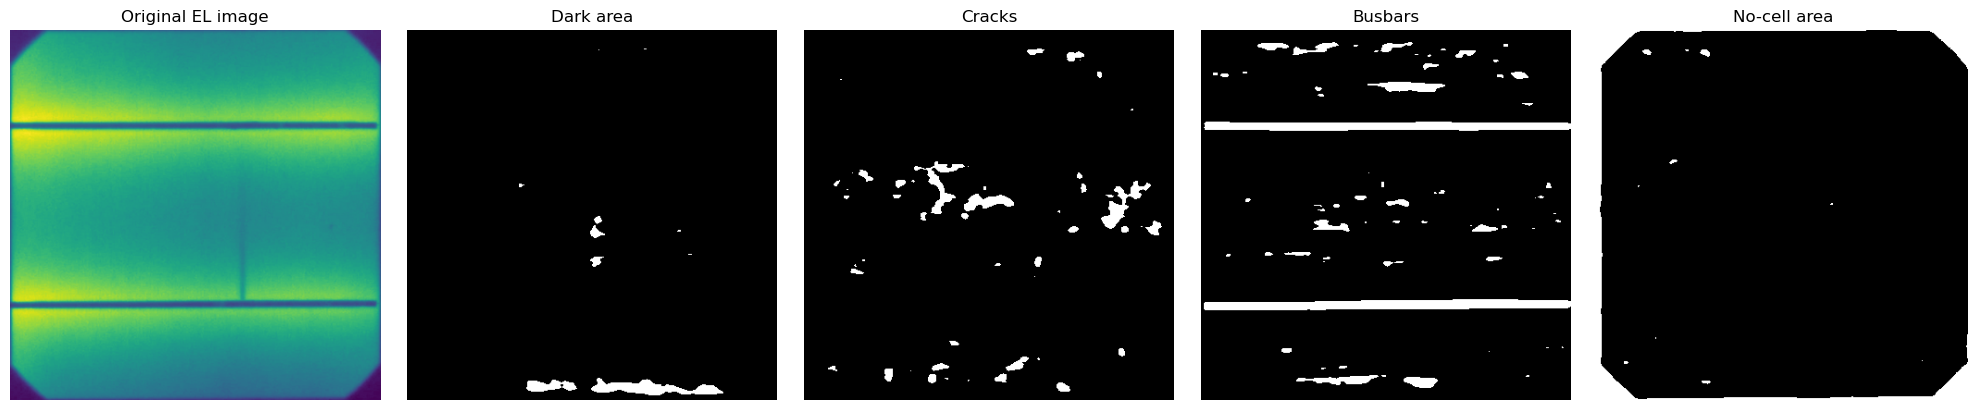
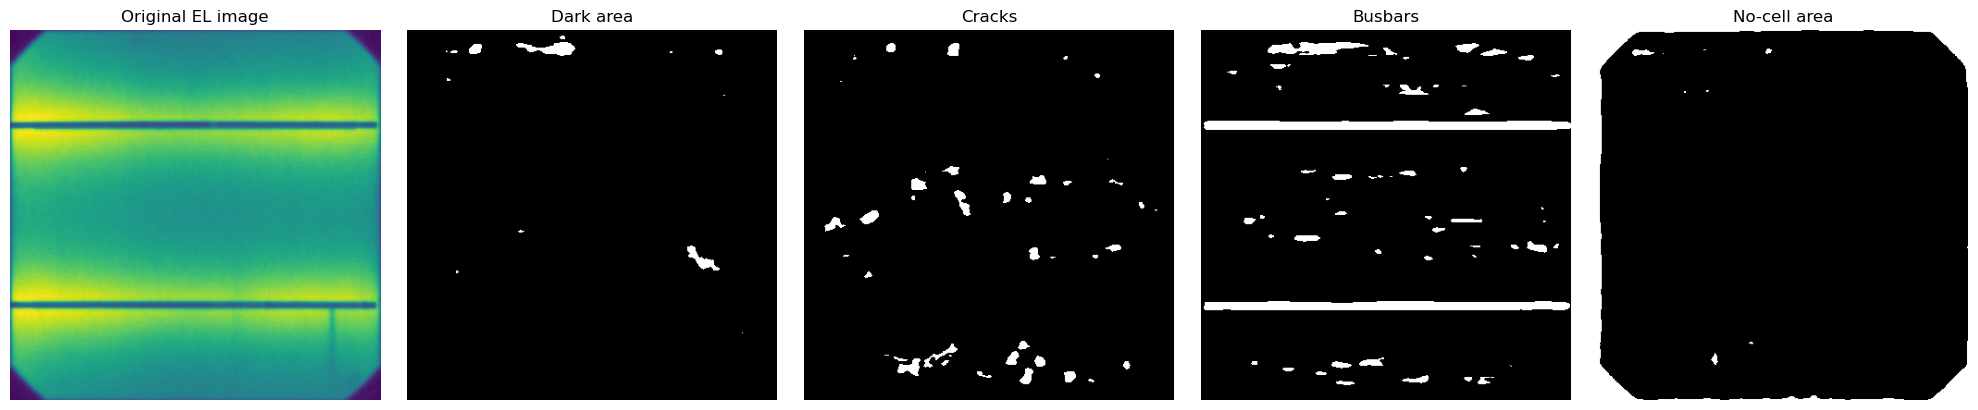
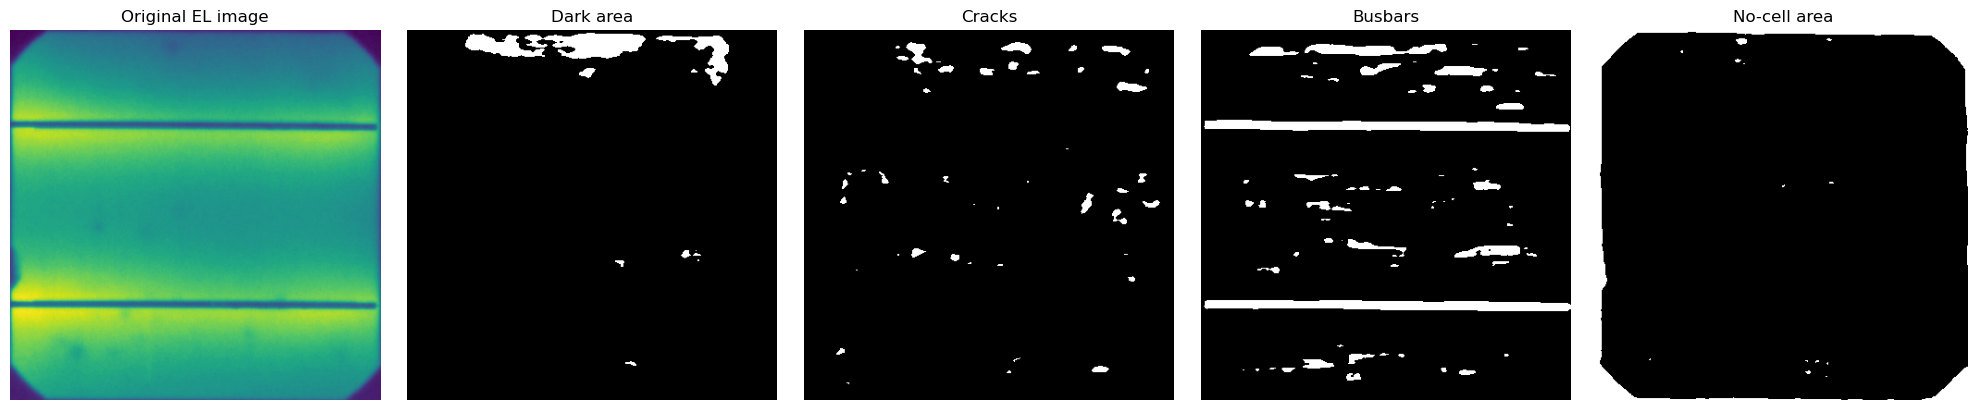
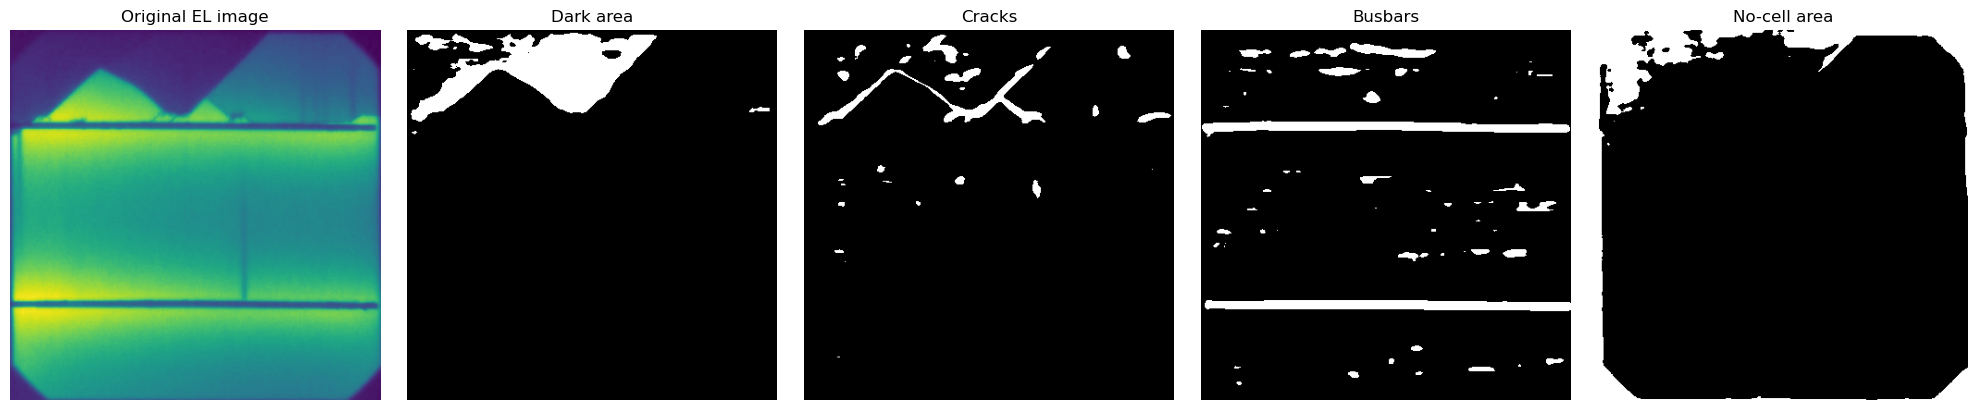
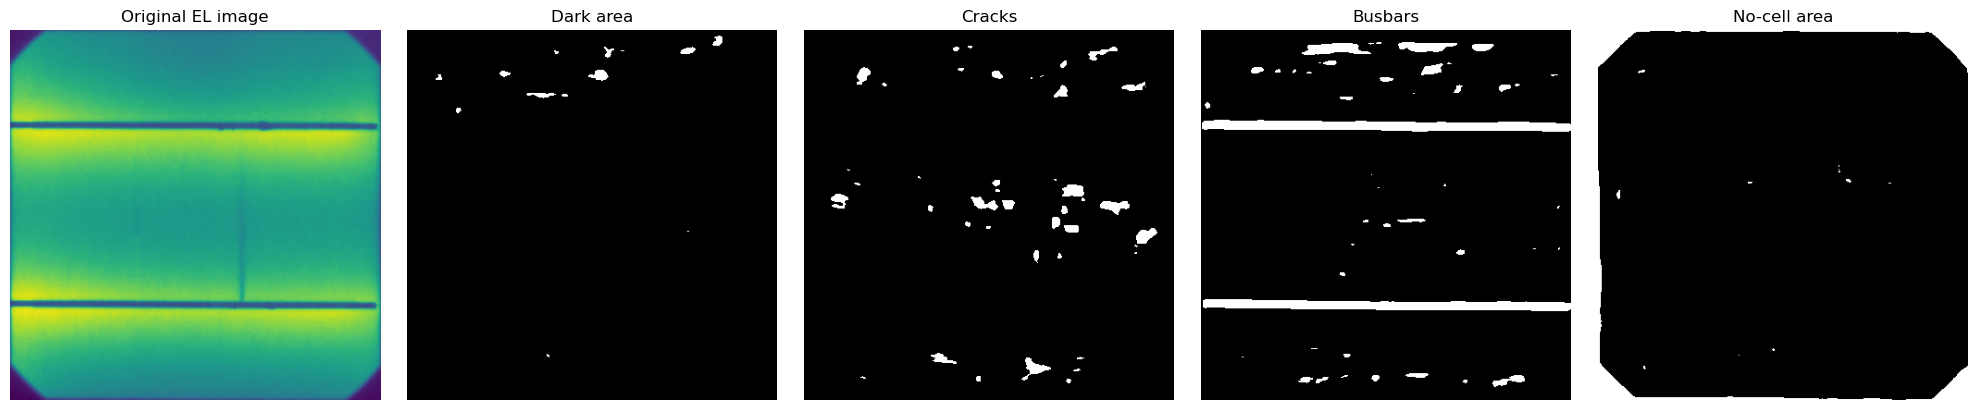
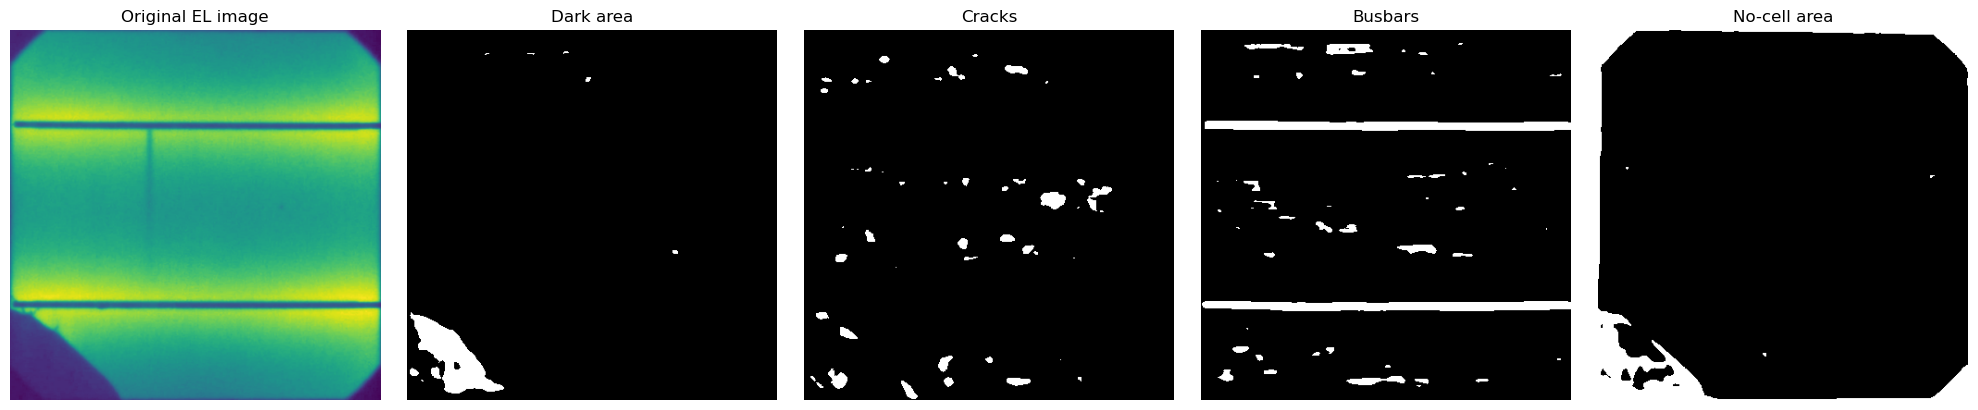
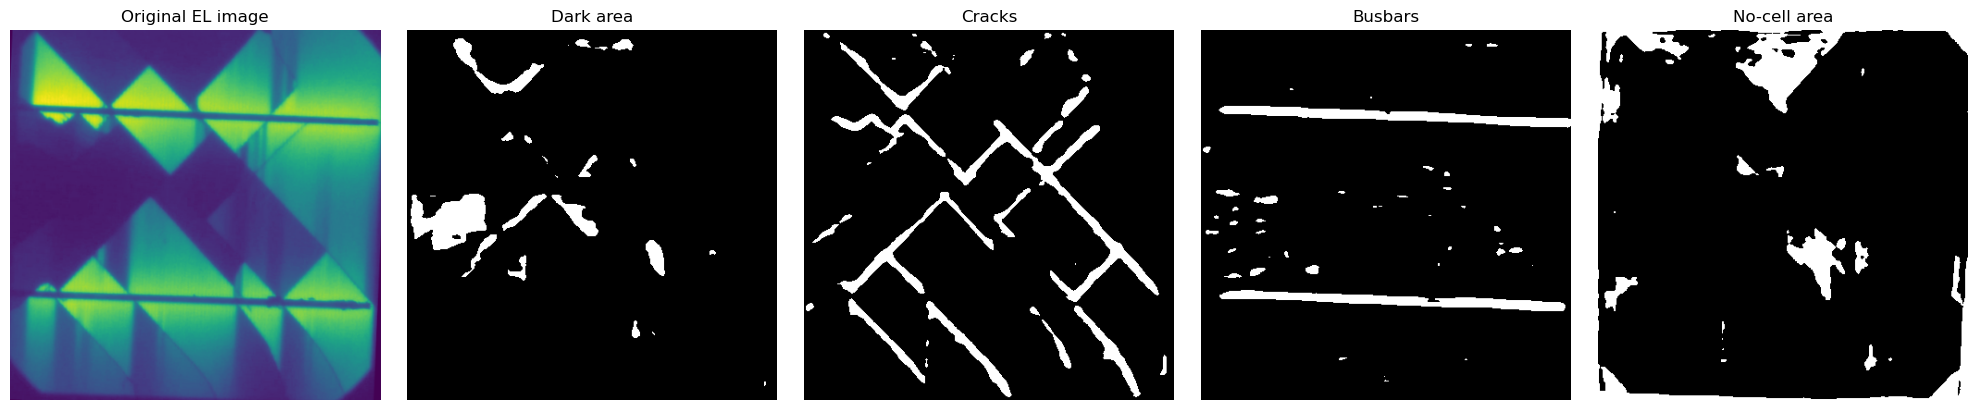
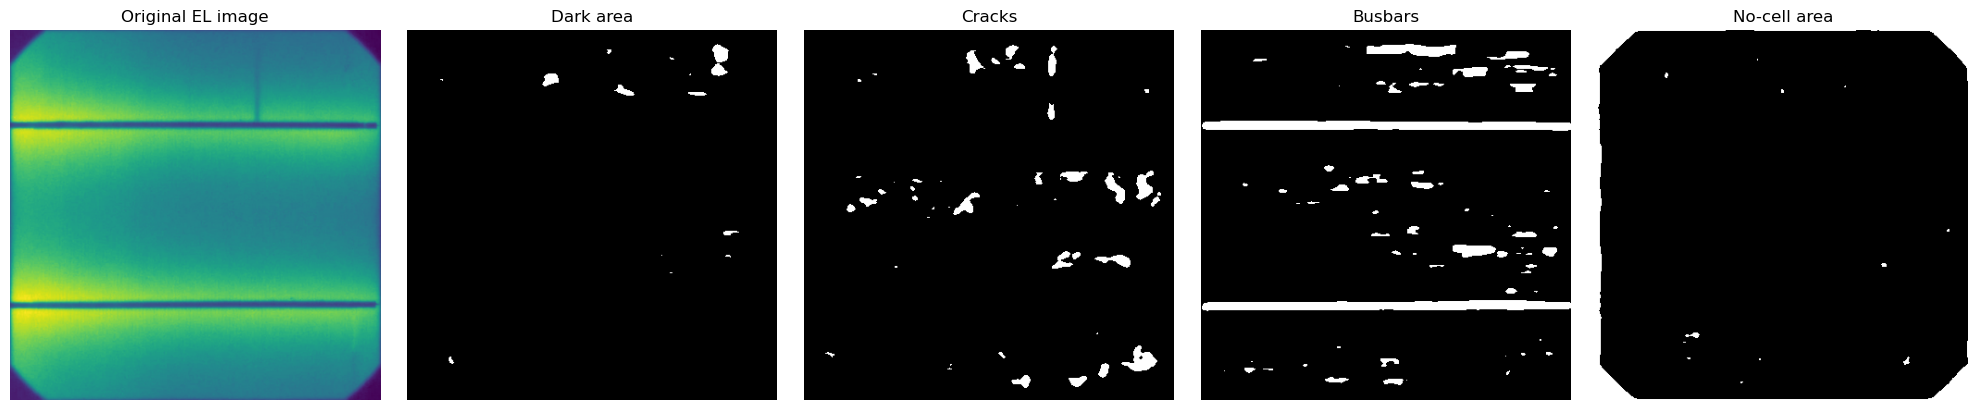
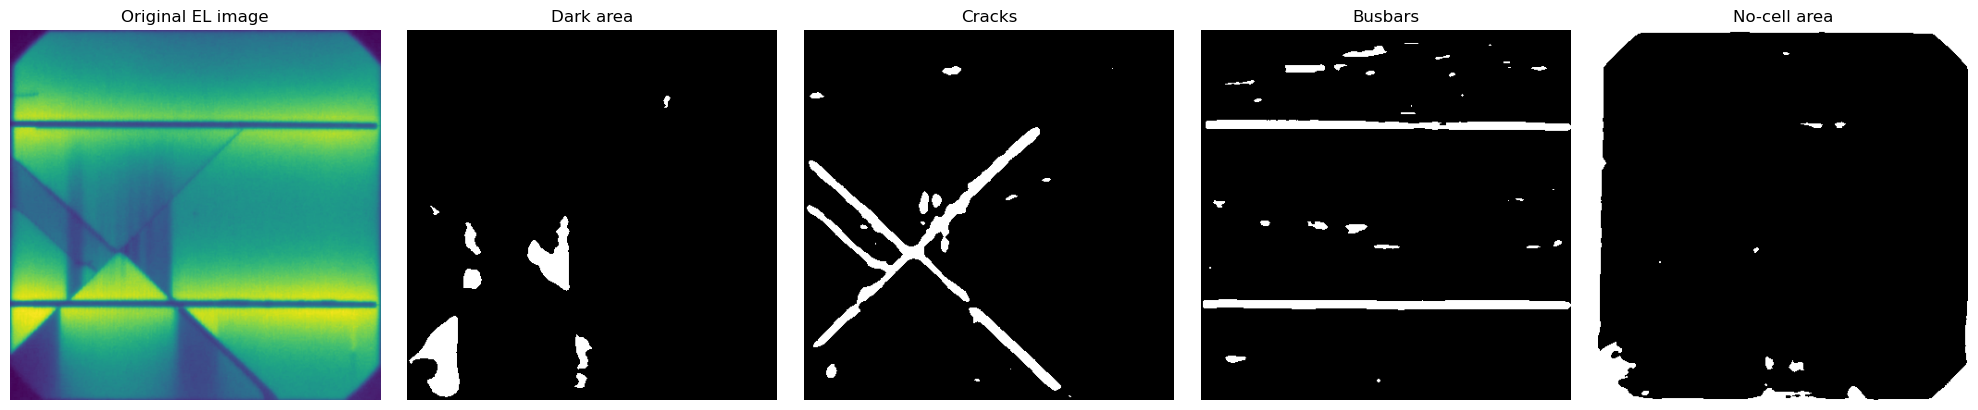
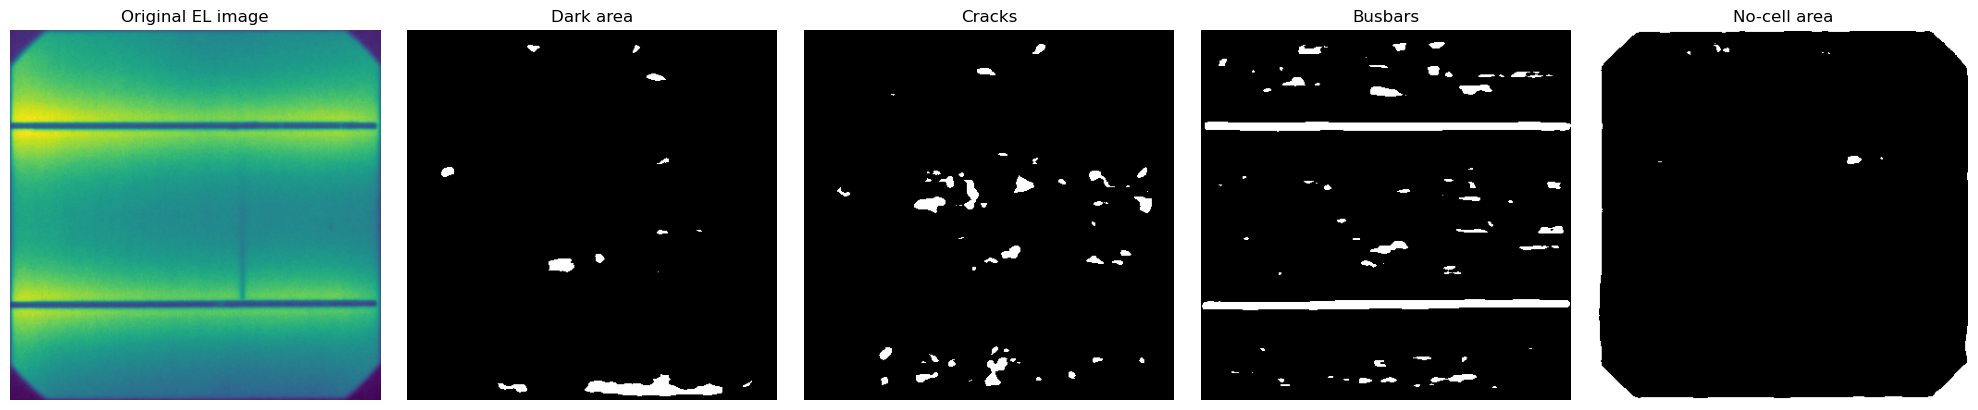

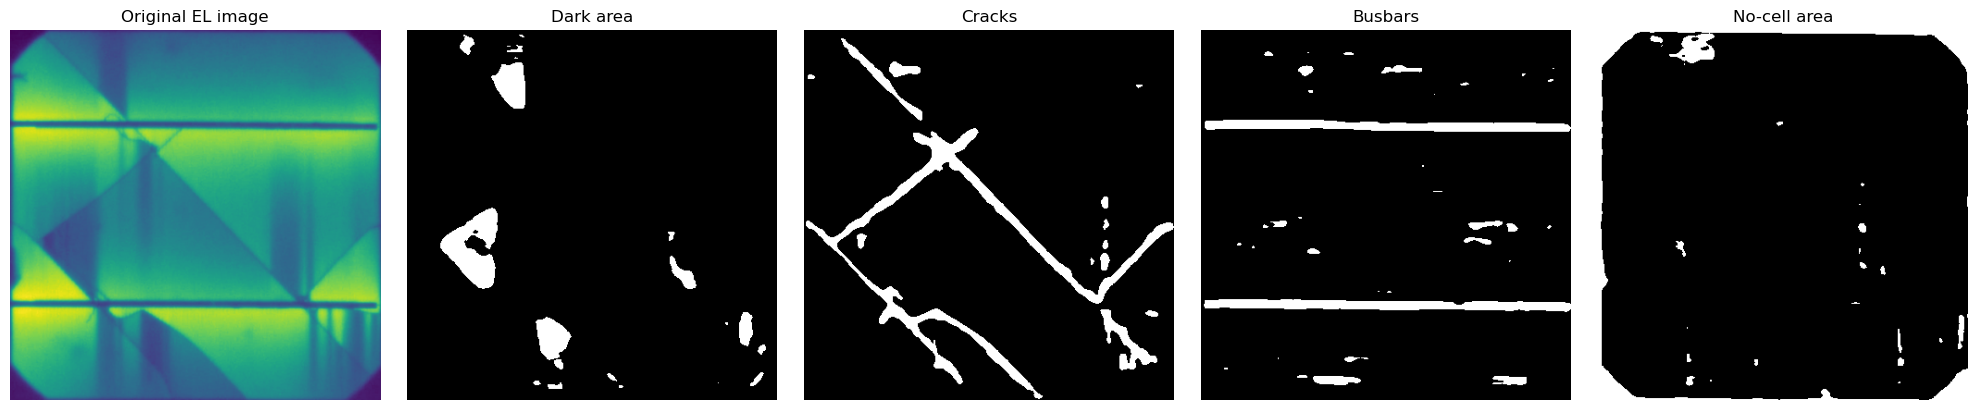
These ELs used as an example have never been seen before by the MultiSolSegment segmentation model. We see that it’s strugelling with some of them particulary when no cracks are visible. Another curiosity is that 5 busbars is the cell type most common in our dataset. So sometimes the model is halucinating more than 2 busbars for these cells.
Next steps to improve this model would be preparing more labeled training data. In addition to using image processing to clean up some of these never seen cells to assist with the labeling.