Example: run MultiSolSegment and validate
This examples hows how to download the weights for MultiSolSegment, run it on an image to segment crack, dark and busbar masks. Then use pvimage to look at crack count and parameters
[1]:
from pathlib import Path
import os
import matplotlib.pyplot as plt
import numpy as np
import pandas as pd
import torch
from torch.utils.data import DataLoader

from pvcracks.utils import viz_functions, train_functions

import requests

from pvimage import features
[2]:
import warnings

warnings.filterwarnings("ignore", category=UserWarning)
warnings.filterwarnings("ignore", category=FutureWarning)
warnings.filterwarnings("ignore", category=RuntimeWarning)
warnings.simplefilter(action="ignore", category=pd.errors.SettingWithCopyWarning)
Step 1: Download Model
[4]:
weight_path = "multisolsegment.pt"

if os.path.exists(weight_path):
    print("Weights already downloaded.")
else:
    response = requests.get(
        "https://datahub.duramat.org/dataset/24d7ed98-956e-4ebc-bf21-6584ecec2ff1/resource/e6d5dee2-0aef-439e-978c-d8c572e7039e/download/model.pt"
    )
    with open(weight_path, "wb") as f:
        f.write(response.content)
Weights already downloaded.
Step 2: Download and Load Images
[ ]:
from zipfile import ZipFile
from io import BytesIO
import os

url = (
    "https://datahub.duramat.org/"
    "dataset/5e7587ad-6ad1-4d6f-8432-70940a6d7ca1/"
    "resource/8f12be45-b929-4f5c-9400-84dde27b0e90/"
    "download/labeledelcells.zip"
)

out_dir = os.path.expanduser("labeled_image_data")
if os.path.exists(out_dir):
    print("Images already downloaded.")
else:
    os.makedirs(out_dir, exist_ok=True)

    resp = requests.get(url)
    resp.raise_for_status()

    with ZipFile(BytesIO(resp.content)) as z:
        z.extractall(path=out_dir)
Images already downloaded.
[6]:
out_dir
[6]:
'labeled_image_data'
Step 3: Set local paths
[ ]:
files_root = f"{out_dir}/LabeledELcells/"
# files_root = "/Users/ojas/Desktop/saj/SANDIA/pvcracks_data/Channeled_Combined_CWRU_LBNL_ASU_No_Empty/"

# if you have have already downloaded model weights, replace this with the local path
# weight_path = "/Users/ojas/Desktop/saj/SANDIA/pvcracks_data/Channeled_Combined_CWRU_LBNL_ASU_No_Empty/checkpoints/Channeled_Combined_CWRU_LBNL_ASU_No_Empty10/epoch_19/model.pt"
Step 4: Load in everything
[8]:
category_mapping = {0: "dark", 1: "busbar", 2: "crack", 3: "non-cell"}

root = Path(files_root)
img_root = root / "img" / "all"

train_dataset, val_dataset = train_functions.load_dataset(root)
val_loader = DataLoader(val_dataset, batch_size=1, shuffle=False)
device, model = train_functions.load_device_and_model(
    category_mapping, existing_weight_path=weight_path
)
Step 5: Pick image and threshold
Index is what image to run this model on.
Threshold is what confidence % we want to code as an actual detection target, rather than just background noise.
[9]:
category_mapping = {0: "dark", 1: "busbar", 2: "crack", 3: "non-cell"}

idx = 7
threshold = 0.5  # default
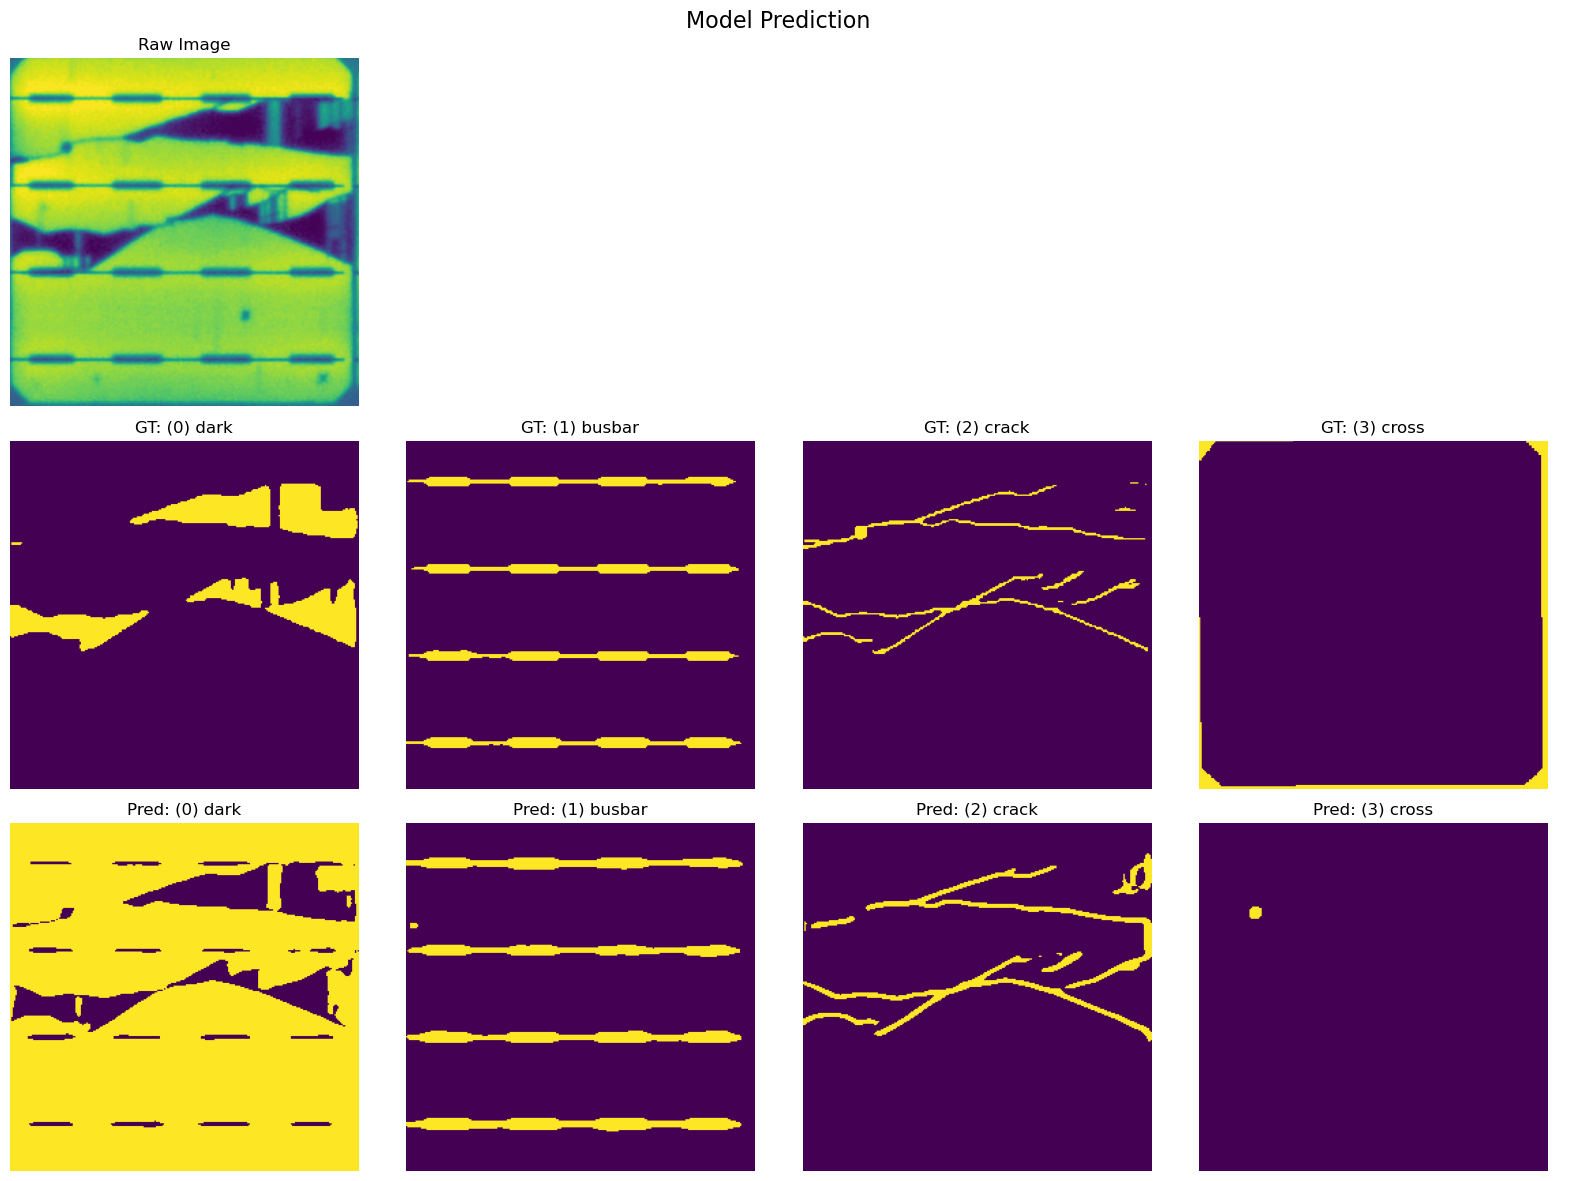
Step 6: Inference and Show
[ ]:
viz_functions.channeled_inference_and_show(
    val_loader, device, model, category_mapping, idx, threshold
)
# plt.savefig("mss_model_prediction.png", dpi=300)
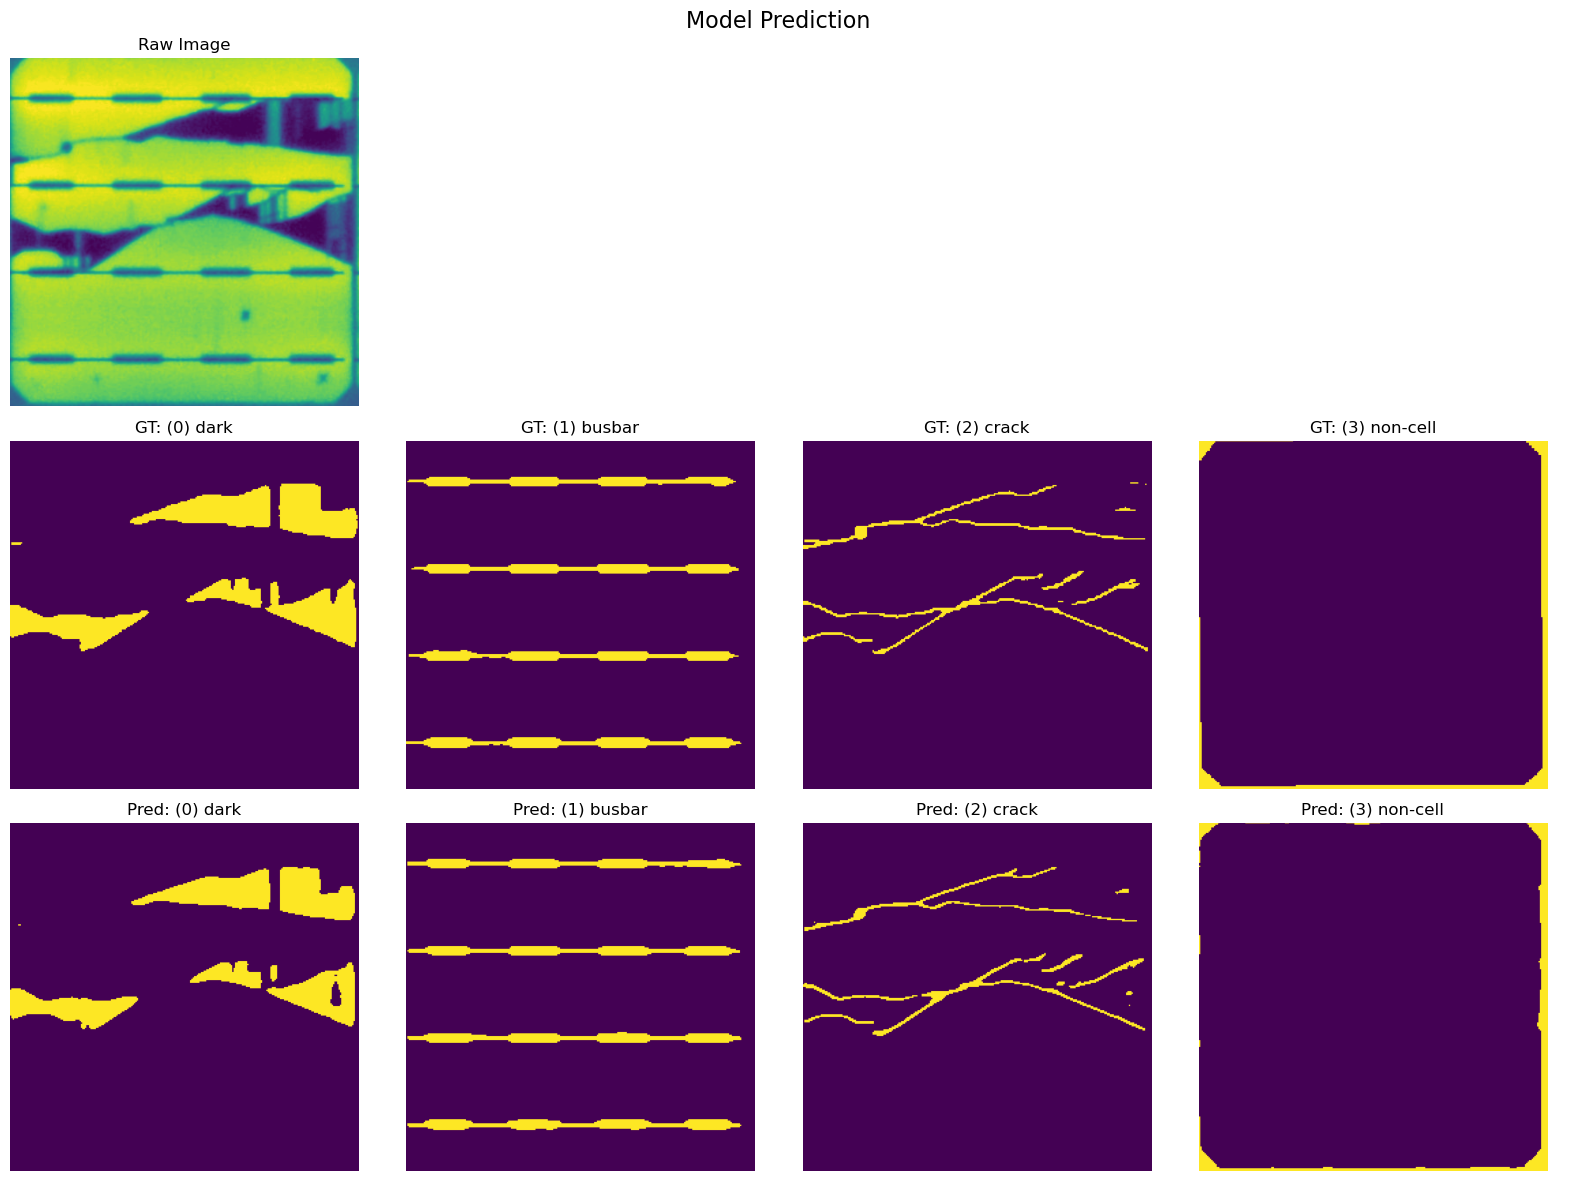
<Figure size 640x480 with 0 Axes>
Step 7: Investigate dark area %
[11]:
def channel_activation_percentages(mask, category_mapping):
    """
    Calculate the percentage of pixels activated for each channel in a multi-hot mask.

    Args:
        mask: 3D array-like of shape (n_channels, height, width) containing multi-hot activations.
        category_mapping (dict): Mapping from channel index to class name. The iteration order
            defines the channel order in the mask tensor.

    Returns:
        dict: Mapping from class name to percentage (0-100) of activated pixels in that channel.
    """

    mask_np = np.asarray(mask)

    if mask_np.ndim != 3:
        raise ValueError(
            f"Expected a 3D mask of shape (channels, height, width); got {mask_np.shape}."
        )

    n_channels, height, width = mask_np.shape
    total_pixels = height * width

    if total_pixels == 0:
        raise ValueError("Mask must contain at least one pixel.")

    percentages = {}
    for channel_idx, class_name in category_mapping.items():
        if channel_idx >= n_channels:
            raise ValueError(
                f"Channel index {channel_idx} for class '{class_name}' is out of bounds "
                f"for mask with {n_channels} channel(s)."
            )
        channel_activation = mask_np[channel_idx].sum()
        percentages[class_name] = (
            float(channel_activation) / float(total_pixels) * 100.0
        )

    return percentages


def print_channel_activation_percentages(percentages):
    print("Predicted channel activation (% of image):")
    sum = 0
    for _, class_name in category_mapping.items():
        print(f"\t{class_name}: {percentages[class_name]:.2f}%")
        sum += percentages[class_name]
    print("\tRemaining (solar cell): %.2f%%\n" % (100 - sum))
[ ]:
img, mask = val_dataset.__getitem__(idx)
img = img.to(device)
img_path = val_dataset.get_img_path(idx)

logits = model(img.unsqueeze(0)).detach().cpu()
probs = torch.sigmoid(logits)
pred_mask = (probs > threshold).float().squeeze(0).numpy()

gt_mask = mask.cpu().numpy()

gt_percentages = channel_activation_percentages(gt_mask, category_mapping)
pred_percentages = channel_activation_percentages(pred_mask, category_mapping)

print_channel_activation_percentages(gt_percentages)
print_channel_activation_percentages(pred_percentages)
Predicted channel activation (% of image):
        dark: 11.16%
        busbar: 7.75%
        crack: 3.05%
        non-cell: 3.70%
        Remaining (solar cell): 74.34%

Predicted channel activation (% of image):
        dark: 10.31%
        busbar: 7.81%
        crack: 3.08%
        non-cell: 3.70%
        Remaining (solar cell): 75.10%
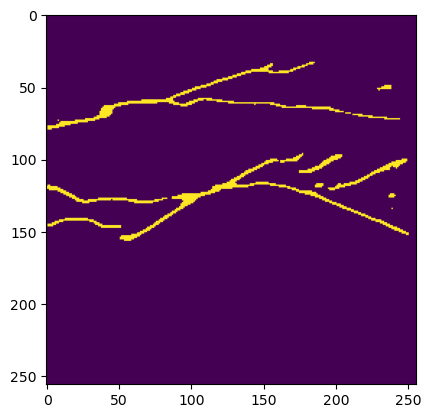
Step 8: Crack mask features with PVImage
Extract predicted crack masks, compute crack statistics with PVImage, and visualize the distribution of key metrics.
[ ]:
img, mask = val_dataset.__getitem__(idx)
img = img.to(device)
img_path = val_dataset.get_img_path(idx)

logits = model(img.unsqueeze(0)).detach().cpu()
probs = torch.sigmoid(logits)
pred_mask = (probs > threshold).float().squeeze(0).numpy()

fig, ax = plt.subplots()
ax.imshow(pred_mask[2], cmap="viridis")
<matplotlib.image.AxesImage at 0x7f5ceb69b890>
[14]:
crack_mask = (pred_mask[2] * 255).astype(np.uint8)  # Convert [0,1] to [0,255]

# Create DataFrame with image path
dfinfo = pd.DataFrame()
dfinfo["impath"] = [str(img_path)]  # Wrap in list

# Run feature extraction
dffeaturesreal = features.feature_extraction_crack_mask([crack_mask], dfinfo)
dffeaturesreal.head()
[14]:
| cell_number | i | prop.perimeter | slope | prop.convex_area | prop.area | prop.orientation | |
|---|---|---|---|---|---|---|---|
| 0 | mxy_0540 | 4 | 745.404112 | -2.728464 | 13499.0 | 5157.0 | -1.459944 |
| 0 | mxy_0540 | 0 | 332.468037 | -1.693958 | 3134.0 | 1898.0 | -1.429506 |
| 0 | mxy_0540 | 2 | 149.59798 | -1.927778 | 949.0 | 789.0 | -1.273929 |
[15]:
def violinplt(data, palette=None, figsize=(5, 4), y_axis_log=False):
    import numpy as np
    import pandas as pd
    import matplotlib.pyplot as plt
    import seaborn as sns

    # Coerce to DataFrame so .mean() and column names behave
    if isinstance(data, pd.Series):
        data = data.to_frame()
    elif not isinstance(data, pd.DataFrame):
        data = pd.DataFrame(data)

    fig, ax = plt.subplots(figsize=figsize)

    # Seaborn API: no widths/showmeans/showmedians/showextrema here
    # Use inner="quartile" to show quartiles; cut=0 to avoid extrapolation
    sns.violinplot(
        data=data,
        ax=ax,
        palette=palette,
        inner="quartile",
        cut=0,
        linewidth=1,
    )

    # Overlay means as points
    means = data.mean().to_numpy()
    x_pos = np.arange(len(means))
    ax.scatter(x_pos, means, zorder=3)

    # Prepare mean labels
    nobs = [f"{m:.2f}" for m in means]

    # Place mean labels slightly above the point
    y_offset = 0.03 * (
        np.nanmax(means) - np.nanmin(means) if np.all(np.isfinite(means)) else 1.0
    )
    if len(x_pos) > 3:
        for i in x_pos:
            t = ax.text(
                i,
                means[i] + y_offset,
                nobs[i],
                ha="center",
                va="bottom",
                fontsize=10,
                color="black",
                weight="semibold",
            )
            # subtle white box for readability
            t.set_bbox(
                dict(
                    facecolor="white",
                    alpha=0.5,
                    edgecolor="none",
                    boxstyle="round,pad=0.15",
                )
            )
        # Rotate tick labels cleanly
        plt.setp(ax.get_xticklabels(), rotation=45, ha="right")
    else:
        for i in x_pos:
            ax.text(
                i,
                means[i] + y_offset,
                nobs[i],
                ha="center",
                va="bottom",
                fontsize=12,
                color="black",
                weight="semibold",
            )

    ax.set_ylabel("Value")
    ax.set_xlabel("")
    if y_axis_log:
        ax.set_yscale("log")
    ax.margins(x=0.05)
    fig.tight_layout()
    return fig
[16]:
dffeaturesreal["count_features"] = dffeaturesreal.groupby("cell_number")[
    "cell_number"
].transform("count")
dffeaturesrealcount = dffeaturesreal.sort_values(by="cell_number").drop_duplicates(
    "cell_number", keep="first"
)
[17]:
dffeaturesrealcount.reset_index(drop=True, inplace=True)

featurescounted = pd.concat(
    [dffeaturesrealcount["count_features"]], axis=1, ignore_index=True
)
featurescounted.columns = ["Original"]
featurescounted.head()
[17]:
| Original | |
|---|---|
| 0 | 3 |
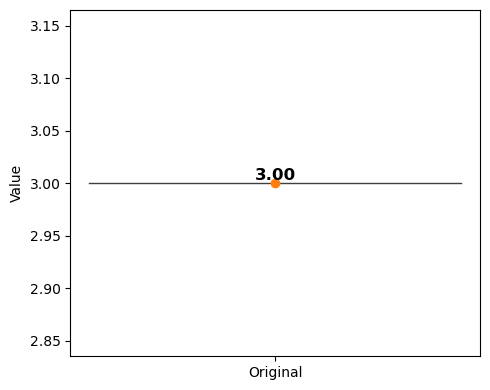
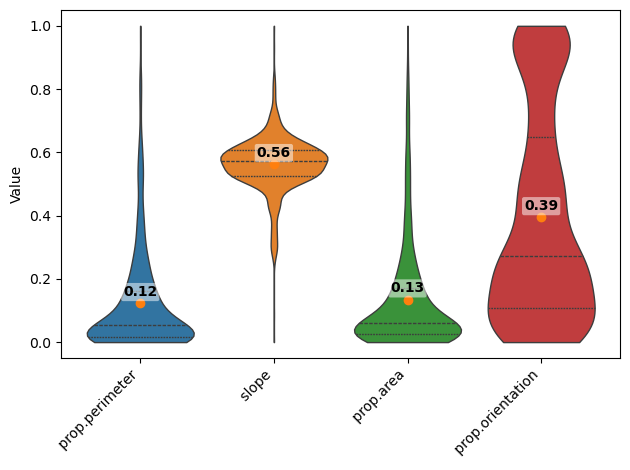
[18]:
from sklearn.preprocessing import MinMaxScaler
dffeaturesall = dffeaturesreal
vp = violinplt(featurescounted[["Original"]], figsize=(5, 4))
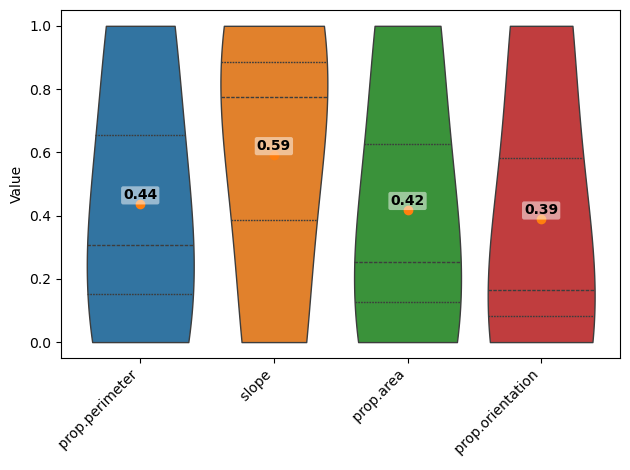
scaler = MinMaxScaler()
columnstonormalize = [
" prop.perimeter",
" slope",
" prop.area",
" prop.orientation",
]
dffeaturesall_norm = dffeaturesall[columnstonormalize]
dffeaturesall_norm[columnstonormalize] = scaler.fit_transform(dffeaturesall_norm)
fig = violinplt(
dffeaturesall_norm[
[
" prop.perimeter",
" slope",
" prop.area",
" prop.orientation",
]
],
figsize=None,
)
# fig.savefig("violins.png", bbox_inches="tight")
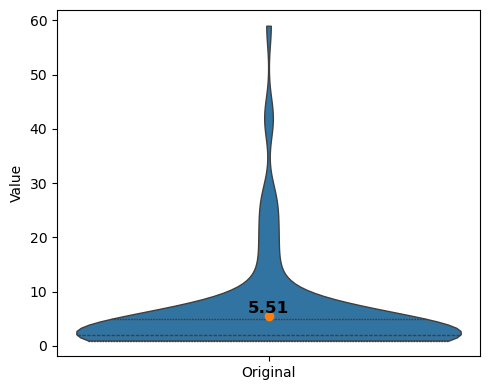
Step 9: PVImage stats for many images
[ ]:
m_idx = len(val_dataset)  # indices to process
masks = []
impaths = []

for i in range(m_idx):
    img, _ = val_dataset.__getitem__(i)
    img = img.to(device)
    img_path = val_dataset.get_img_path(i)

    # model inference
    logits = model(img.unsqueeze(0)).detach().cpu()
    probs = torch.sigmoid(logits)
    pred_mask = (probs > threshold).float().squeeze(0).numpy()  # (n_classes, H, W)

    # Extract crack channel (index 2) and convert to uint8 [0,255]
    crack_mask = (pred_mask[2] * 255).astype(np.uint8)

    masks.append(crack_mask)
    impaths.append(str(img_path))

# Build dataframe of image paths expected by feature_extraction_crack_mask
dfinfo_multi = pd.DataFrame({"impath": impaths})

# Run PVImage feature extraction across all predicted crack masks
dffeatures_multi = features.feature_extraction_crack_mask(masks, dfinfo_multi)
print(
    f"Processed {len(masks)} ground-truth images, extracted {len(dffeatures_multi)} feature rows."
)
display(dffeatures_multi.head())
Processed 585 ground-truth images, extracted 601 feature rows.
| cell_number | i | prop.perimeter | slope | prop.convex_area | prop.area | prop.orientation | |
|---|---|---|---|---|---|---|---|
| 0 | mxy_sa19965_sub_EL_9 | 2 | 271.740115 | -0.298467 | 2296.0 | 1497.0 | -0.486834 |
| 0 | mxy_sa19965_sub_EL_9 | 8 | 266.468037 | -0.155785 | 1826.0 | 1403.0 | -0.386939 |
| 0 | mxy_sa19965_sub_EL_9 | 4 | 235.39697 | -1.476617 | 2109.0 | 1289.0 | -1.394845 |
| 0 | mxy_sa19965_sub_EL_9 | 5 | 233.39697 | 0.500036 | 2353.0 | 1422.0 | 0.739917 |
| 0 | SW2 | 1 | 157.556349 | 1.625017 | 887.0 | 789.0 | 1.500654 |
[20]:
dffeatures_multi["count_features"] = dffeatures_multi.groupby("cell_number")[
    "cell_number"
].transform("count")
dffeatures_multi_count = dffeatures_multi.sort_values(by="cell_number").drop_duplicates(
    "cell_number", keep="first"
)
dffeatures_multi_count.reset_index(drop=True, inplace=True)

featurescounted_multi = pd.concat(
    [dffeatures_multi_count["count_features"]], axis=1, ignore_index=True
)
featurescounted_multi.columns = ["Original"]

# Show basic outputs
print(f"Processed {len(masks)} images, extracted {len(dffeatures_multi)} feature rows.")
display(featurescounted_multi.head())
Processed 585 images, extracted 601 feature rows.
| Original | |
|---|---|
| 0 | 1 |
| 1 | 2 |
| 2 | 1 |
| 3 | 3 |
| 4 | 3 |
[21]:
dffeatures_multi.to_pickle("mms_dffeatures.pickle")
dffeatures_multi = pd.read_pickle("mms_dffeatures.pickle")
[22]:
vp = violinplt(featurescounted_multi[["Original"]], figsize=(5, 4))
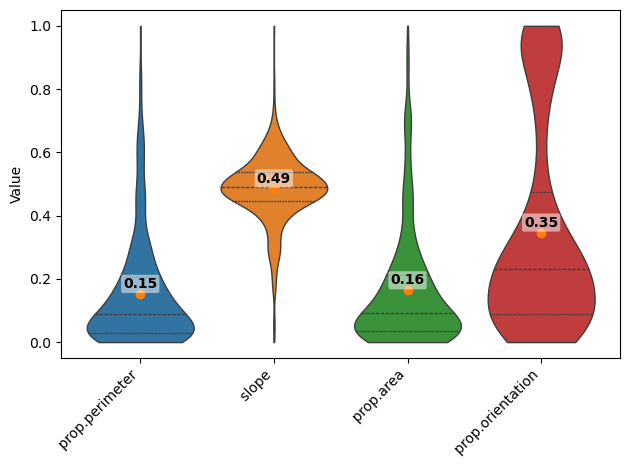
[23]:
scaler = MinMaxScaler()
columnstonormalize = [
    " prop.perimeter",
    " slope",
    " prop.area",
    " prop.orientation",
]
dffeatures_multi_norm = dffeatures_multi[columnstonormalize]
dffeatures_multi_norm[columnstonormalize] = scaler.fit_transform(dffeatures_multi_norm)
fig = violinplt(
    dffeatures_multi_norm[
        [
            " prop.perimeter",
            " slope",
            " prop.area",
            " prop.orientation",
        ]
    ],
    figsize=None,
)
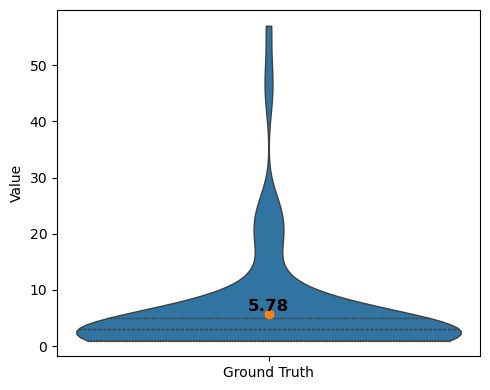
Step 10: PVImage stats for ground truth crack masks
[ ]:
gt_masks = []
gt_impaths = []

for i in range(m_idx):
    _, gt_mask = val_dataset.__getitem__(i)
    img_path = val_dataset.get_img_path(i)

    crack_mask_gt = (gt_mask.cpu().numpy()[2] * 255).astype(np.uint8)

    gt_masks.append(crack_mask_gt)
    gt_impaths.append(str(img_path))

dfinfo_gt = pd.DataFrame({"impath": gt_impaths})
dffeatures_gt = features.feature_extraction_crack_mask(gt_masks, dfinfo_gt)


display(dffeatures_gt.head())
| cell_number | i | prop.perimeter | slope | prop.convex_area | prop.area | prop.orientation | |
|---|---|---|---|---|---|---|---|
| 0 | mxy_sa19965_sub_EL_9 | 7 | 214.083261 | -1.170103 | 1893.0 | 1167.0 | -1.370287 |
| 0 | mxy_sa19965_sub_EL_9 | 14 | 206.325902 | -0.380381 | 1568.0 | 1059.0 | -1.052619 |
| 0 | mxy_sa19965_sub_EL_9 | 4 | 162.426407 | -0.890218 | 1256.0 | 887.0 | -0.862461 |
| 0 | SW2 | 3 | 119.313708 | 1.319687 | 616.0 | 546.0 | 1.455919 |
| 0 | my_SW1 | 0 | 454.575685 | -0.897546 | 5464.0 | 2804.0 | -0.985487 |
[25]:
dffeatures_gt["count_features"] = dffeatures_gt.groupby("cell_number")[
    "cell_number"
].transform("count")
dffeatures_gt_count = dffeatures_gt.sort_values(by="cell_number").drop_duplicates(
    "cell_number", keep="first"
)
dffeatures_gt_count.reset_index(drop=True, inplace=True)

featurescounted_gt = pd.concat(
    [dffeatures_gt_count["count_features"]], axis=1, ignore_index=True
)
featurescounted_gt.columns = ["Ground Truth"]

display(featurescounted_gt.head())
print(
    f"Processed {len(gt_masks)} ground-truth images, extracted {len(dffeatures_gt)} feature rows."
)
| Ground Truth | |
|---|---|
| 0 | 1 |
| 1 | 2 |
| 2 | 1 |
| 3 | 4 |
| 4 | 4 |
Processed 585 ground-truth images, extracted 590 feature rows.
[26]:
vp = violinplt(featurescounted_gt[["Ground Truth"]], figsize=(5, 4))
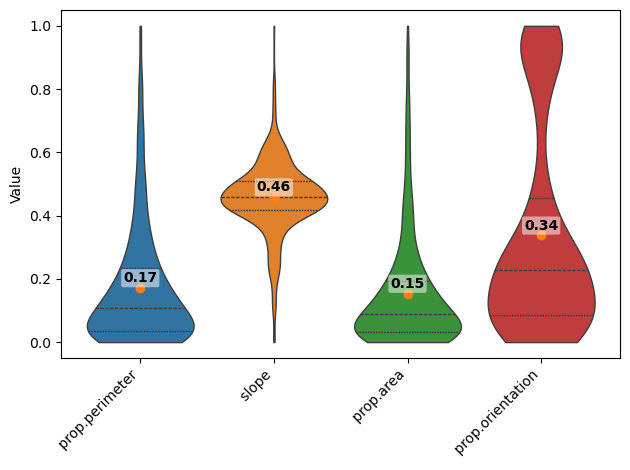
[27]:
scaler = MinMaxScaler()
columnstonormalize = [
    " prop.perimeter",
    " slope",
    " prop.area",
    " prop.orientation",
]
dffeatures_gt_norm = dffeatures_gt[columnstonormalize]
dffeatures_gt_norm[columnstonormalize] = scaler.fit_transform(dffeatures_gt_norm)
fig = violinplt(
    dffeatures_gt_norm[
        [
            " prop.perimeter",
            " slope",
            " prop.area",
            " prop.orientation",
        ]
    ],
    figsize=None,
)
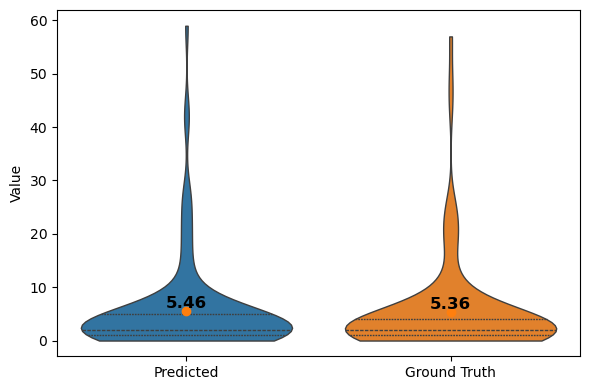
Step 11: Compare PVImage stats (predicted vs. ground truth)
Join the PVImage outputs to see how the model’s crack counts and shape metrics differ from the labeled data.
[28]:
pred_counts = dffeatures_multi.groupby("cell_number").size().rename("pred_crack_count")
gt_counts = dffeatures_gt.groupby("cell_number").size().rename("gt_crack_count")

count_comparison = (
    pd.concat([pred_counts, gt_counts], axis=1).fillna(0).astype(int).reset_index()
)
count_comparison.columns = ["cell_number", "pred_crack_count", "gt_crack_count"]
count_comparison["count_diff"] = (
    count_comparison["pred_crack_count"] - count_comparison["gt_crack_count"]
)

display(count_comparison.head())
| cell_number | pred_crack_count | gt_crack_count | count_diff | |
|---|---|---|---|---|
| 0 | 0563 | 1 | 1 | 0 |
| 1 | 0774 | 2 | 2 | 0 |
| 2 | 0809 | 1 | 1 | 0 |
| 3 | 0_EL_18.09.2023 | 3 | 4 | -1 |
| 4 | 1090 | 3 | 4 | -1 |
[29]:
vp = violinplt(
    count_comparison[["pred_crack_count", "gt_crack_count"]].rename(
        columns={
            "pred_crack_count": "Predicted",
            "gt_crack_count": "Ground Truth",
        }
    ),
    figsize=(6, 4),
)
[30]:
feature_cols = [
    " prop.perimeter",
    " slope",
    " prop.area",
    " prop.orientation",
]
feature_comparison = pd.DataFrame(
    {
        "Predicted_mean": dffeatures_multi_norm[feature_cols].mean(),
        "GroundTruth_mean": dffeatures_gt_norm[feature_cols].mean(),
    }
)
feature_comparison["abs_diff"] = (
    feature_comparison["Predicted_mean"] - feature_comparison["GroundTruth_mean"]
).abs()
feature_comparison
[30]:
| Predicted_mean | GroundTruth_mean | abs_diff | |
|---|---|---|---|
| prop.perimeter | 0.151889 | 0.170860 | 0.018971 |
| slope | 0.485083 | 0.457917 | 0.027167 |
| prop.area | 0.163280 | 0.153094 | 0.010186 |
| prop.orientation | 0.345932 | 0.337139 | 0.008792 |
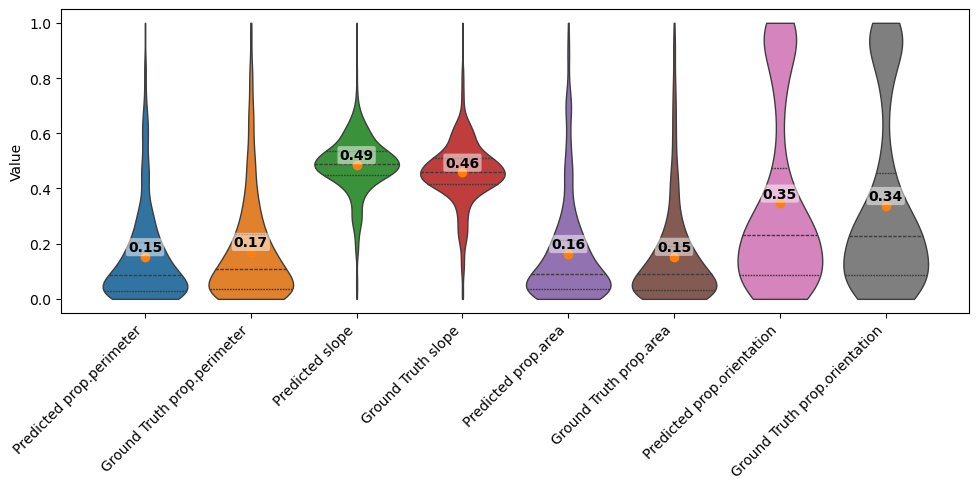
[31]:
feature_pairs = []

for col in feature_cols:
    if (
        col not in dffeatures_multi_norm.columns
        or col not in dffeatures_gt_norm.columns
    ):
        print(f"Skipping {col}: not found in features dataframe.")
        continue

    label = col.strip()
    pred = dffeatures_multi_norm[col].reset_index(drop=True)
    gt = dffeatures_gt_norm[col].reset_index(drop=True)

    max_len = max(len(pred), len(gt))
    if max_len == 0:
        print(f"Skipping {label}: no data to plot.")
        continue

    pred = pred.reindex(range(max_len))
    gt = gt.reindex(range(max_len))

    feature_pairs.append(
        pd.DataFrame(
            {
                f"Predicted {label}": pred,
                f"Ground Truth {label}": gt,
            }
        )
    )

if not feature_pairs:
    print("No feature data available for violin plots.")
    feature_violin_df = pd.DataFrame()
else:
    feature_violin_df = pd.concat(feature_pairs, axis=1)
    feature_violin_df = feature_violin_df.apply(pd.to_numeric, errors="coerce")
    feature_violin_df = feature_violin_df.dropna(axis=1, how="all")

    if feature_violin_df.empty:
        print("No numeric feature data available for violin plots.")
    else:
        # Render comparison violins
        vp = violinplt(feature_violin_df, figsize=(10, 5))

feature_violin_df
[31]:
| Predicted prop.perimeter | Ground Truth prop.perimeter | Predicted slope | Ground Truth slope | Predicted prop.area | Ground Truth prop.area | Predicted prop.orientation | Ground Truth prop.orientation | |
|---|---|---|---|---|---|---|---|---|
| 0 | 0.078961 | 0.057378 | 0.517969 | 0.420981 | 0.077577 | 0.047678 | 0.344652 | 0.063179 |
| 1 | 0.076532 | 0.053472 | 0.528462 | 0.483016 | 0.070977 | 0.041025 | 0.376496 | 0.164383 |
| 2 | 0.062214 | 0.031365 | 0.431319 | 0.442967 | 0.062974 | 0.030430 | 0.055206 | 0.224965 |
| 3 | 0.061292 | 0.009654 | 0.576696 | 0.616562 | 0.072311 | 0.009425 | 0.735703 | 0.963567 |
| 4 | 0.026345 | 0.178485 | 0.659435 | 0.442391 | 0.027871 | 0.148515 | 0.978202 | 0.185770 |
| ... | ... | ... | ... | ... | ... | ... | ... | ... |
| 596 | 0.000177 | NaN | 0.475078 | NaN | 0.009407 | NaN | 0.201521 | NaN |
| 597 | 0.120884 | NaN | 0.463893 | NaN | 0.148343 | NaN | 0.233929 | NaN |
| 598 | 0.086195 | NaN | 0.501708 | NaN | 0.098568 | NaN | 0.284622 | NaN |
| 599 | 0.096668 | NaN | 0.521463 | NaN | 0.103131 | NaN | 0.054135 | NaN |
| 600 | 0.003081 | NaN | 0.533490 | NaN | 0.011303 | NaN | 0.027597 | NaN |
601 rows × 8 columns
Do same for pv-vision
[ ]:
# Load pv-vision model and weights
from tutorials.unet_model import construct_unet  # this tutorial is from pv-vision
from torch.nn import DataParallel

device = torch.device("cpu")

# build & wrap
unet = construct_unet(5)
unet = DataParallel(unet)

# load the dict right out of the file — no prefixing
state_dict = torch.load(
    "unet_oversample_low_final_model_for_paper/model.pt", map_location=device
)

unet.load_state_dict(state_dict)
model_pvvision = unet.module.to(device)
[ ]:
category_mapping = {
    0: "dark",
    1: "busbar",
    2: "crack",
    3: "cross",
}  # I think this is the third category "x-cracks"

idx = 7
threshold = 0.5  # default
[ ]:
viz_functions.channeled_inference_and_show(
    val_loader,
    device=device,
    model=model_pvvision,
    category_mapping=category_mapping,
    idx=idx,
    threshold=0.5,
)
plt.savefig("pvvision_model_prediction.png", dpi=300)
<Figure size 640x480 with 0 Axes>
[ ]:
# All images
m_idx = len(val_dataset)  # indices to process
masks = []
impaths = []

for i in range(m_idx):
    img, _ = val_dataset.__getitem__(i)
    img = img.to(device)
    img_path = val_dataset.get_img_path(i)

    # model inference
    logits = model_pvvision(img.unsqueeze(0)).detach().cpu()
    probs = torch.sigmoid(logits)
    pred_mask = (probs > threshold).float().squeeze(0).numpy()  # (n_classes, H, W)

    # Extract crack channel (index 2) and convert to uint8 [0,255]
    crack_mask = (pred_mask[2] * 255).astype(np.uint8)

    masks.append(crack_mask)
    impaths.append(str(img_path))

# Build dataframe of image paths expected by feature_extraction_crack_mask
dfinfo_multi = pd.DataFrame({"impath": impaths})

# Run PVImage feature extraction across all predicted crack masks
dffeatures_multi_pvvision = features.feature_extraction_crack_mask(masks, dfinfo_multi)
print(
    f"Processed {len(masks)} ground-truth images, extracted {len(dffeatures_multi)} feature rows."
)
display(dffeatures_multi_pvvision.head())

dffeatures_multi_pvvision["count_features"] = dffeatures_multi_pvvision.groupby(
    "cell_number"
)["cell_number"].transform("count")
dffeatures_multi_count = dffeatures_multi_pvvision.sort_values(
    by="cell_number"
).drop_duplicates("cell_number", keep="first")
dffeatures_multi_count.reset_index(drop=True, inplace=True)

featurescounted_multi = pd.concat(
    [dffeatures_multi_count["count_features"]], axis=1, ignore_index=True
)
featurescounted_multi.columns = ["Original"]

# Show basic outputs
print(f"Processed {len(masks)} images, extracted {len(dffeatures_multi)} feature rows.")
display(featurescounted_multi.head())


dffeatures_multi_pvvision.to_pickle("pvvision_dffeatures.pickle")
dffeatures_multi_pvvision = pd.read_pickle("pvvision_dffeatures.pickle")
Processed 585 ground-truth images, extracted 572 feature rows.
| cell_number | i | prop.perimeter | slope | prop.convex_area | prop.area | prop.orientation | |
|---|---|---|---|---|---|---|---|
| 0 | mxy_sa19965_sub_EL_9 | 1 | 552.83557 | -0.524613 | 7743.0 | 3487.0 | -0.699696 |
| 0 | mxy_sa19965_sub_EL_9 | 4 | 198.325902 | -0.461665 | 1710.0 | 1447.0 | -0.683089 |
| 0 | SW2 | 0 | 153.59798 | -0.985689 | 1174.0 | 924.0 | -1.113709 |
| 0 | SW2 | 10 | 127.313708 | 0.557848 | 809.0 | 630.0 | 1.319049 |
| 0 | SW2 | 2 | 115.213203 | 0.222527 | 666.0 | 580.0 | 0.33296 |
Processed 585 images, extracted 572 feature rows.
| Original | |
|---|---|
| 0 | 1 |
| 1 | 2 |
| 2 | 1 |
| 3 | 2 |
| 4 | 9 |
[ ]:
# Add ground truth
pred_counts = (
    dffeatures_multi_pvvision.groupby("cell_number").size().rename("pred_crack_count")
)
gt_counts = dffeatures_gt.groupby("cell_number").size().rename("gt_crack_count")

count_comparison = (
    pd.concat([pred_counts, gt_counts], axis=1).fillna(0).astype(int).reset_index()
)
count_comparison.columns = ["cell_number", "pred_crack_count", "gt_crack_count"]
count_comparison["count_diff"] = (
    count_comparison["pred_crack_count"] - count_comparison["gt_crack_count"]
)

scaler = MinMaxScaler()
columnstonormalize = [
    " prop.perimeter",
    " slope",
    " prop.area",
    " prop.orientation",
]
dffeatures_multi_norm = dffeatures_multi_pvvision[columnstonormalize]
dffeatures_multi_norm[columnstonormalize] = scaler.fit_transform(dffeatures_multi_norm)
fig = violinplt(
    dffeatures_multi_norm[
        [
            " prop.perimeter",
            " slope",
            " prop.area",
            " prop.orientation",
        ]
    ],
    figsize=None,
)
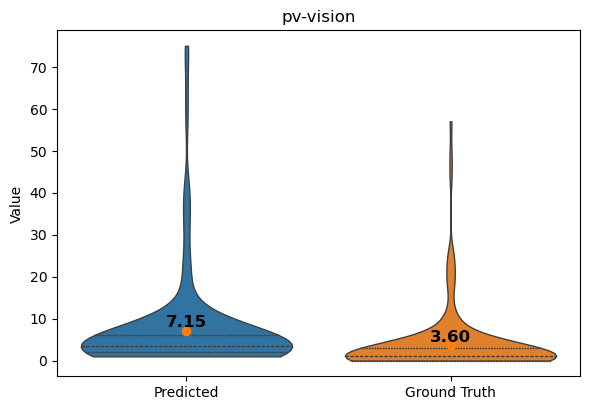
[57]:
vp = violinplt(
    count_comparison[["pred_crack_count", "gt_crack_count"]].rename(
        columns={
            "pred_crack_count": "Predicted",
            "gt_crack_count": "Ground Truth",
        }
    ),
    figsize=(6, 4),
)
plt.title("pv-vision")
[57]:
Text(0.5, 1.0, 'pv-vision')
[58]:
feature_cols = [
    " prop.perimeter",
    " slope",
    " prop.area",
    " prop.orientation",
]
feature_comparison = pd.DataFrame(
    {
        "Predicted_mean": dffeatures_multi_norm[feature_cols].mean(),
        "GroundTruth_mean": dffeatures_gt_norm[feature_cols].mean(),
    }
)
feature_comparison["abs_diff"] = (
    feature_comparison["Predicted_mean"] - feature_comparison["GroundTruth_mean"]
).abs()
feature_comparison
[58]:
| Predicted_mean | GroundTruth_mean | abs_diff | |
|---|---|---|---|
| prop.perimeter | 0.122926 | 0.170860 | 0.047934 |
| slope | 0.562446 | 0.457917 | 0.104529 |
| prop.area | 0.134435 | 0.153094 | 0.018659 |
| prop.orientation | 0.394483 | 0.337139 | 0.057343 |
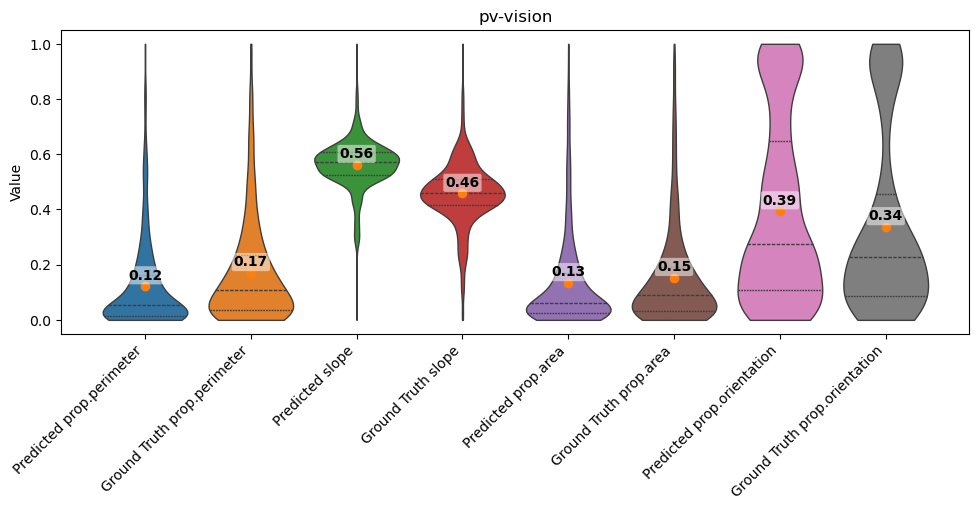
[59]:
feature_pairs = []

for col in feature_cols:
    if (
        col not in dffeatures_multi_norm.columns
        or col not in dffeatures_gt_norm.columns
    ):
        print(f"Skipping {col}: not found in features dataframe.")
        continue

    label = col.strip()
    pred = dffeatures_multi_norm[col].reset_index(drop=True)
    gt = dffeatures_gt_norm[col].reset_index(drop=True)

    max_len = max(len(pred), len(gt))
    if max_len == 0:
        print(f"Skipping {label}: no data to plot.")
        continue

    pred = pred.reindex(range(max_len))
    gt = gt.reindex(range(max_len))

    feature_pairs.append(
        pd.DataFrame(
            {
                f"Predicted {label}": pred,
                f"Ground Truth {label}": gt,
            }
        )
    )

if not feature_pairs:
    print("No feature data available for violin plots.")
    feature_violin_df = pd.DataFrame()
else:
    feature_violin_df = pd.concat(feature_pairs, axis=1)
    feature_violin_df = feature_violin_df.apply(pd.to_numeric, errors="coerce")
    feature_violin_df = feature_violin_df.dropna(axis=1, how="all")

    if feature_violin_df.empty:
        print("No numeric feature data available for violin plots.")
    else:
        # Render comparison violins
        vp = violinplt(feature_violin_df, figsize=(10, 5))
        plt.title("pv-vision")

feature_violin_df
[59]:
| Predicted prop.perimeter | Ground Truth prop.perimeter | Predicted slope | Ground Truth slope | Predicted prop.area | Ground Truth prop.area | Predicted prop.orientation | Ground Truth prop.orientation | |
|---|---|---|---|---|---|---|---|---|
| 0 | 0.224055 | 0.057378 | 0.551249 | 0.420981 | 0.216021 | 0.047678 | 0.277144 | 0.063179 |
| 1 | 0.048634 | 0.053472 | 0.556411 | 0.483016 | 0.075988 | 0.041025 | 0.282431 | 0.164383 |
| 2 | 0.026501 | 0.031365 | 0.513440 | 0.442967 | 0.040088 | 0.030430 | 0.145335 | 0.224965 |
| 3 | 0.013495 | 0.009654 | 0.640013 | 0.616562 | 0.019907 | 0.009425 | 0.919853 | 0.963567 |
| 4 | 0.007507 | 0.178485 | 0.612516 | 0.442391 | 0.016474 | 0.148515 | 0.605911 | 0.185770 |
| ... | ... | ... | ... | ... | ... | ... | ... | ... |
| 1168 | 0.018054 | NaN | 0.626138 | NaN | 0.036793 | NaN | 0.738026 | NaN |
| 1169 | 0.012385 | NaN | 0.602619 | NaN | 0.018808 | NaN | 0.542269 | NaN |
| 1170 | 0.001909 | NaN | 0.631208 | NaN | 0.006796 | NaN | 0.664104 | NaN |
| 1171 | 0.131226 | NaN | 0.599652 | NaN | 0.177993 | NaN | 0.994440 | NaN |
| 1172 | 0.001499 | NaN | 0.592021 | NaN | 0.012287 | NaN | 0.003767 | NaN |
1173 rows × 8 columns
[ ]: